 This is an open access article distributed under the terms of the Creative Commons
Attribution License (
This is an open access article distributed under the terms of the Creative Commons
Attribution License (Introduction
Zuckerman (1979) defined sensation seeking as a biosocial personality trait characterized by “the need for varied, novel, and complex sensations and experiences, and the willingness to take physical and social risks for the sake of such experiences” (p. 10). Sensation seeking is a multi-determined construct influenced by genetic, biological, psychophysiological and social factors, which affect behaviors and preferences (Zuckerman, 1990, 1994, 1996).
Empirical evidence suggests that sensation seeking is often linked to risk taking. Individuals high in sensation seeking seem more likely to engage in alcohol and illicit drug use (Cicognani & Zani, 2011; Kopstein, Crum, Celentano, & Martin, 2001; Legrand, Gomà-i-Freixanet, Kaltenbach, & Joly, 2007; MacPherson, Magidson, Reynolds, Kahler, & Lejuez, 2010; Manna, Casiglia, & Faraci, 2010), reckless driving (Curran, Fuertes, Alfonso, & Hennessy, 2010; Desrichard & Denarié, 2005; Heino, van der Molen, & Wilde, 1996), dangerous sports (Diehm & Armatas, 2004; Hansen & Breivik, 2001), and sexual risk behaviors (Hoyle, Fejfar, & Miller, 2000).
In terms of the dimensional aspects of the construct, sensation seeking was initially assessed by Zuckerman, Kolin, Price, and Zoob (1964) as a single, general trait using the Sensation Seeking Scale (Form I and Form II). Subsequent factor analyses conducted on both Form I (Zuckerman & Link, 1968) and Form II (Farley, 1967) suggested that the structure of sensation seeking comprised more than one dimension. Zuckerman and Link (1968) identified four factors for males (Thrill Sensation Seeking, Social Sensation Seeking, Visual Sensation Seeking, Antisocial Sensation Seeking) and only the first two factors for females. However, Form I items did not clearly explain these factors. Consequently, Zuckerman (1971) developed an experimental form (Form III) of 113 items with the aim of further investigating factorial structure. The findings identified the following four factors for the new Form IV (Zuckerman, 1971): Thrill and Adventure Seeking (TAS); Experience Seeking (ES); Disinhibition (Dis); and Boredom Susceptibility (BS). This last factor differed in the case of men and women but was nevertheless maintained. The general factor was not a satisfactory measure because did not contain any items from the Disinhibition subscale. To overcome this limitation, the researchers developed Form V (Zuckerman, Eysenck, & Eysenck, 1978), in which the total sensation seeking score derived from the sum of the ten-item subscales.
To develop Form V, the 72-item Form IV was administered to a large sample of British and American subjects, and the data were factor analyzed using an oblique rotation separately for males and females. To obtain an equal item distribution and to reduce the length of the test, a 40-item scale with ten items for each of the four factors was developed. The items with loadings greater than .30 on the specific factors were selected for the new Form V scale. The same four-factor structure of Form IV was found in all samples and produced both a total score and scores based on the four-factor, analytically derived subscales.
The answer format for all forms of the Zuckerman sensation seeking scales was a dichotomous forced choice, which is useful to reduce the influence of social desirability. However, in some studies, a five-point Likert format was used (Feij, Van Zuilen, & Gazendam, 1982; Gray & Wilson, 2007) with the intention of offering more response choices. In Form VI, Zuckerman (1984) used a 3-point response scale, and the questionnaire presented the entire list of activities twice: the first section concerned actual experiences, and the second section concerned intentions for the future. Besides, Arnett (1994) noted many problems about the Sensation Seeking Scale – Form V: several items reflected the American and British culture at the time the questionnaire was devised, and the forced-choice response format might create problems for participants who find that either both or neither choices apply to them. A new sensation seeking scale was thus proposed – the Arnett Inventory of Sensation Seeking (AISS, 1994).
Nevertheless, at present, Form V remains the standard and most frequently used form to assess the construct of sensation seeking. The Sensation Seeking Scale V (SSS-V; Zuckerman et al., 1978) has been translated into many languages (Andresen, 1986; Birenbaum, 1986; Öngen, 2007; Ripa, Skovdahl Hansen, Mortensen, Sanders, & Machover Reinisch, 2001; Wang et al., 2000), and many studies have investigated the presence of its four-factor structure across cultures and genders. Ball, Farnill, and Wangeman (1983) used a large sample of Australian men and women and found a good correspondence for a four-factor solution, but they also identified several items that were inappropriate because they failed to load on the correct factor. A similar conclusion was reached by Rowland and Franken (1986), who factored sensation-seeking items using male and female Canadian students. Their results showed that two items for males and three items for females did not load significantly on the expected factors. In an Israeli sample, Birenbaum and Montag (1987) found that only three of the four factors identified by Zuckerman yielded factorial replicability, and the Experience Seeking items did not load on the expected factor.
As regards age difference, many studies have thoroughly postulated that sensation seeking increases during early adolescence, and steadily declines thereafter (Roth, Schumacher, & Brähler, 2005; Zuckerman, 1979). The fact that sensation seeking tendencies intensify around pre-adolescence is linked to changes in pubertal maturation (Martin et al., 2002).
Further contribution to this thesis was provided by neurobiological evidence, which supports the presence of two distinct systems, the socioemotional and the cognitive control system (Steinberg, 2008). According to the above-mentioned neurobiological model, the increase in sensation seeking around the time of puberty is linked to a rapid increase in dopaminergic activity within the socioemotional system, and precedes the structural maturation of the cognitive control system (Steinberg et al., 2008).
Given the increased incidence of involvement in risk-taking behaviors by early adolescents and young adults (Roberti, Storch, & Bravata, 2003), research must include psychometrically sound operational measures for predicting sensation-seeking traits in large-scale survey studies of behavioral problems.
Although many studies have been conducted in different cultures (Aluja, Garcia, & Garcia, 2004; Ferrando & Chico, 2001; Haynes, Miles, & Clements, 2000), a limited number of research studies have examined the psychometric characteristics of the SSS – Form V in the Italian-speaking culture. Salvadori, Lazzeroni, and Primi (2007) assessed the SSS-V factor structure using explorative and confirmative factor analyses among a sample of 461 (400 females; 61 males) students from the University of Florence. Their results did not confirm the four factors structure of SSS-V, but revealed a two factors model: TAS (9 items) and Dis (7 items) closely connected with the original dimensions. Their data showed that the BS and ES items did not load significantly on the expected factor, only two items of ES are included in Dis dimension.
With the main aim to examine the factorial structure of the SSS-V in the Italian context, the present study investigates the psychometric properties of the Italian version of the scale. This research tests the metrological qualities of the instrument by (a) examining the item distribution; (b) exploring the factorial structure of the scale; (c) confirming the identified factorial model; (d) describing reliability in terms of internal consistency; and (e) providing evidence of construct validity.
Methods
Participants
This study involved 1,798 participants, divided into two groups. Group 1 included 1,530 students, 38.8% males and 61.5% females, with a mean age of 18.16 years (SD = 2.75; range = 13-24), from different Sicilian high schools (19.3% scientific high school, 14.4% classic high school, 4.4% artistic high school, 4.6% technical high school, 21.8% professional high school, and 5.4% language high school) and from several college courses (2% medicine, 17.6% psychology, 5.4% arts, 2.5% geology, and 2.6% math).
Group 2 included 268 students (52.6% males and 47.4% females), with a mean age of 16.3 years (SD = 1.49; range = 13-19), from several Sicilian high schools (19.4% scientific high school, 25% classic high school, 55.6% technical high school).
Instruments and Procedure
In the present study, the following assessment instruments were used:
-
The back-translated version of the Sensation Seeking Scale – Form V (SSS-V; Zuckerman et al., 1978), which was developed to measure individual differences in stimulation and arousal needs. This scale consists of 40 dichotomous forced-choice items, each belonging to one of the four 10-item subscales:
-
Thrill and Adventure Seeking (TAS), characterized by a desire to engage in sports or other physically risky activities involving speed or danger (e.g., item 16 A: I would like to take up the sport of water-skiing; B. I would not like to take up water-skiing);
-
Experience Seeking (ES), referring to the need for novel personal or inner sensations and experiences through the mind and senses, travel, and a non-conforming life-style (e.g., item 10 A: I would not like to try any drug that might produce strange and dangerous effects on me; B. I would like to try some of the drugs that produce hallucinations);
-
Disinhibition (Dis), referring to seeking sensation through social activities, such as parties, social drinking and variety in sexual partners (e.g., item 30 A: Heavy drinking usually ruins a party because some people get loud and boisterous; B. Keeping the drinks full is the key to a good party);
-
Boredom Susceptibility (BS), representing an intolerance for routine or predictability and restlessness when things are unchanging (e.g., item 5 A: I get bored seeing the same old faces; B. I like the comfortable familiarity of everyday friends).
-
-
The Impulsiveness Questionnaire (IVE; Eysenck, Pearson, Easting, & Allsopp, 1985), a dichotomous 54-item questionnaire consisting of three subscales: Impulsiveness (I) (e.g., item 9: Do you generally act and speak without thinking first?), Venturesomeness (V) (e.g., item 30: Do you like to do things that are a little frightening?), and Empathy (E). In this study, the Impulsiveness and Venturesomeness scales were used in their Italian adaptation (Dazzi, Pedrabissi, & Santinello, 2004).
The SSS-V was administered both to groups 1 and 2. The IVE was administered only to group 2.
The data were collected in small group sessions with the anonymity of the participants assured. The administrations were conducted during class time with trained examiners. The respondents were asked to provide their personal details and were instructed to complete the questionnaires themselves.
Data Analyses
Item analysis was used to select items for the Italian version of the questionnaire. Items representing more than 70% of respondents holding one of the two options were excluded based on their poor discriminative capability to discern the construct being measured (Kline, 1999).
The remaining items were subjected to exploratory factor analysis to reveal the underlying dimensional structure. Generalized Least Squares, which is applicable for categorical variables, was selected as the method for factor extraction (Muthén, du Toit, & Spisic, 1997). An orthogonal rotation criterion (varimax) was used to obtain a simple structure. We decided to extract the number of factors determined by random data parallel analyses (Horn, 1965). The eigenvalues derived from the actual data were compared to the eigenvalues derived from the random data. Factors were retained as long as the ith eigenvalue from the actual data was greater than the ith eigenvalue from the random data (O’Connor, 2000). Both Kaiser’s (1961) criterion (items with eigenvalues greater than 1) and the Scree Test (Cattell, 1966) were secondarily checked for agreement. The following three criteria were used for salience: (a) factor loadings with absolute values greater than .30 on the primary factor, ensuring a high degree of association between the item and the factor; (b) a difference of .30 between loading on the primary factor and loading on other factors, when an item loaded simultaneously on two factors; and (c) a minimum of three items for each factor, thus ensuring the meaningful interpretation of stable factors (Tabachnick & Fidell, 1996). Factor analyses were performed using SPSS Statistical Packages for Social Sciences 17.0.
A confirmatory factor analysis, using ML (Maximum Likelihood) robust estimation procedures, was performed using the EQS Structural Equation Program Version 6.1 (Bentler, 2006). Both orthogonal and oblique factor models were tested. To statistically evaluate the closeness of the hypothetical model to the empirical data, multiple goodness-of-fit indexes were used, including the ratio of the chi-square to degrees of freedom (χ2/df), the Non-Normed Fit Index (NNFI), the Comparative Fit Index (CFI), the Standardized Root Mean Square Residual (SRMR), and the Root Mean Square Error of Approximation (RMSEA). The Satorra-Bentler chi-square (S-B χ2) was not used as an evaluation of absolute fit because of its sensitivity to sample size. To test the model, each variable was allowed to load on only one factor, and one variable loading in each factor was fixed at 1.0. The remaining factor loadings, residual variances, and correlations among latent factors were freely estimated.
The internal consistency of the scales, as a measure of the reliability of the questionnaire, was computed using the alpha coefficient. Corrected item-scale correlations were examined for each of the scales. For the item selection, it was determined that the adjusted item-total correlations for each item of a scale should exceed .30, which is recommended as the standard for supporting item-internal consistency (De Vellis, 2003). The Pearson correlation coefficient was used to investigate the extent to which factor scores were correlated.
To perform a construct validation, the correlations between our instrument and the Impulsiveness Questionnaire were analyzed.
Results
Item Analysis
Based on the item analysis conducted on group 1, fourteen items were dropped from the original version of the instrument: items 10, 18, 19 and 37 from the subscale Experience Seeking; items 11, 17 and 38 from the subscale Thrill and Adventure Seeking; items 30 and 36 from the subscale Disinhibition; and items 2, 5, 7, 31 and 34 from the subscale Boredom Susceptibility.
Exploratory Factor Analysis
The exploratory factor analysis of the remaining twenty-six items (using group 1) revealed a bi-factorial solution. Fourteen items that failed to meet the retention criteria were not retained. In particular, items 4, 6, 8, 15, 24, 26, 27, 33 and 39 presented factor loadings lower than .30; items 1, 9 and 29 loaded simultaneously on both the Dis and ES factors; and item 22 resulted in a single item. The sum of the variance for the two dimensions accounted for 28.72% of the variance for the questionnaire. Table 1 presents item factor loadings.
Table 1
Exploratory Factor Analysis: Rotated Factor Matrix
| Items | TAS | Dis |
|---|---|---|
| item 23 | .626 | |
| item 3 | .578 | |
| item 16 | .550 | |
| item 28 | .512 | |
| item 20 | .504 | |
| item 21 | .497 | |
| item 40 | .471 | |
| item 12 | .557 | |
| item 13 | .538 | |
| item 32 | .480 | |
| item 35 | .467 | |
| item 25 | .449 |
Note. TAS = Thrill and adventure seeking; Dis = Disinhibition.
The first factor, labeled TAS (7 items), accounted for 17.52% of the total variance. It included items from the original TAS subscale. The second factor, Dis (5 items), accounted for 11.20% of the total variance. It included items from the original Dis subscale.
Confirmatory Factor Analysis
Because the chi-square test is biased by the sample size, the number of variables and the degrees of freedom in a model, the statistically significant Satorra-Bentler scaled chi-square was not surprising: [chi]2(51, N = 1530) = 90.30; p = .000; χ2/df = 1.77.
The confirmatory factor analysis performed on group 1 showed reasonable goodness-of-fit for a two-factor model. The fit indexes met the criteria for adequacy of fit for the model, indicating that the hypothesized factor structure was plausible (NNFI = .98; CFI = .99; SRMR = .04; RMSEA = .02; 90% confidence interval = .015, .030) (Faraci & Musso, in press). The oblique solution provided a significantly better fit for the data than the orthogonal model (see Table 2).
Table 2
Fit Indexes for the Orthogonal and Oblique Bi-Factorial Models
| Model | χ2 | df | p | χ2 /gl | NNFI | CFI | SRMR | RMSEA | 90% CI |
|---|---|---|---|---|---|---|---|---|---|
| Orthogonal | 134.44 | 52 | .000 | 2.59 | .96 | .97 | .09 | .03 | .026-.039 |
| Oblique | 90.30 | 51 | .000 | 1.77 | .98 | .99 | .04 | .02 | .015-.030 |
All manifest variables loaded significantly (p < .05) on their hypothesized latent factors. Figure 1 presents the standardized parameter estimates.
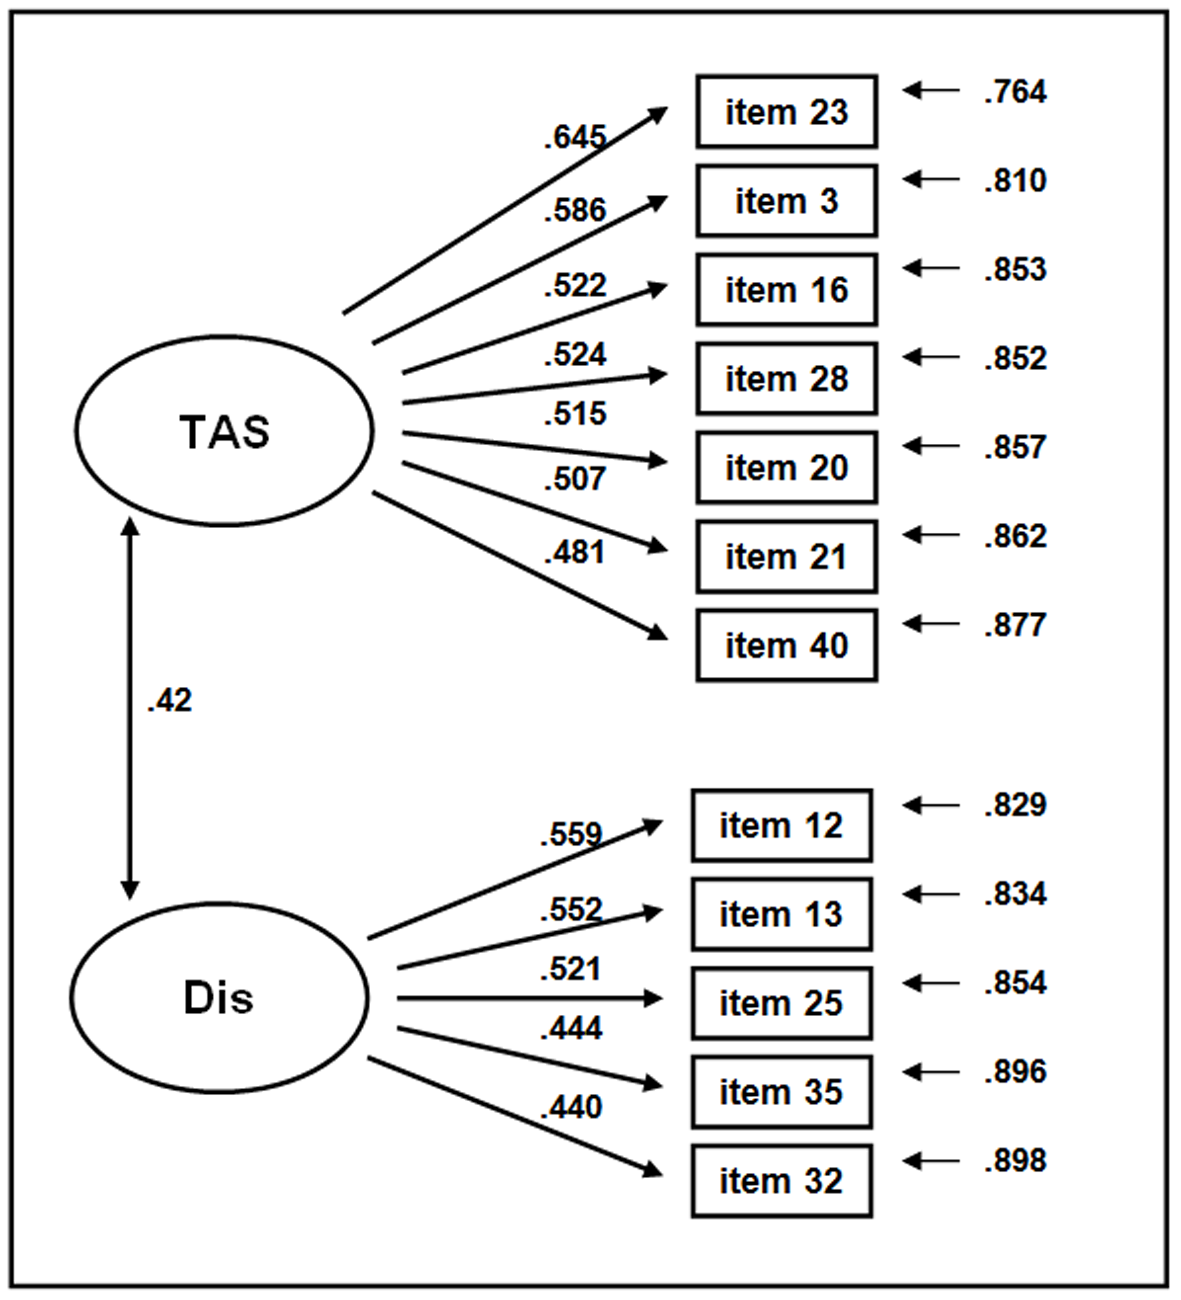
Figure 1
Confirmatory factor analysis: Empirical model (standardized solution).
The two-factor model was judged to be an adequate explanation of the data. This suggests that the instrument comprises two unidimensional subscales: TAS and Dis.
Internal Consistency
Alpha coefficients for the two dimensions were calculated using group 1. Internal consistency can be considered as acceptable for Thrill and Adventure Seeking (α = .74 with corrected item-total correlation ranging from .41 to .53) and questionable for Disinhibition (α = .63 with corrected item-total correlation ranging from .36 to .42) (George & Mallery, 2003).
Factors Intercorrelation
As expected, the dimensions were significantly (p < .01, two-tailed tests) but moderately (r = .42) intercorrelated, indicating that the questionnaire’s subscales measured several approaches to sensation seeking.
Construct Validity
Evidence for convergent validity was provided by correlations between our instrument and the IVE (subscales of Venturesomeness and Impulsiveness). The relationships between the two IVE subscales and both the total score of the new adapted test and the Dis subscale were significant and positive (p < .01). The subscale TAS presented a significant and positive correlation with Venturesomeness and no correlation with Impulsiveness. These results are reported in Table 3.
Table 3
Correlations With the Impulsiveness Questionnaire (IVE)
| TAS | Dis | SSS-V Total score | |
|---|---|---|---|
| IVE - Venturesomeness | .676** | .456** | .725** |
| IVE - Impulsiveness | .097 | .276** | .212** |
Discussion
This study was firstly designed to evaluate the dimensionality of the SSS-V in a large sample of Italian adolescents by combining exploratory and confirmatory factor procedures. Our findings replicate previous outcomes highlighting some significant problems with the factorial structure of the scale. The two-factor structure that emerged from exploratory factor analysis – Thrill and Adventure Seeking and Disinhibition – appeared to be in line with the model derived from similar studies (Salvadori et al., 2007). The items we removed have been shown to be problematic in earlier research, as well.
Most former studies aimed to replicate the structure of the SSS-V in different countries and cultures have found that the psychometric properties of the scale could be improved. Problems were identified with a number of items, including (a) multifactorial items; (b) high loadings on secondary factors; (c) items with loadings of absolute values of less than .30; (d) a low degree of variance accounted for by four factors; and (e) low reliability levels for the Experience Seeking and Boredom Susceptibility subscales. Our study confirms that several items of the SSS-V did not load on the expected factor, which may reflect cultural and generational influences on the original items. The factorial structure of the SSS-V in non-English-speaking cultures has been found to be less replicable than the English version (Birenbaum, 1986; Eysenck, & Haapasalo, 1989; Terasaki, Shiomi, Kishimoto, & Hiraoka, 1987). This finding may indicate that although the items may be culturally relevant for a country sample, this may not be the case for other populations or, as Arnett argued, several items might reflect the culture at the time the questionnaire was devised. Future research should attempt to develop a diverse bank of items to obtain the most replicable factor structure.
According to the fit indexes from the confirmatory factor analysis (Faraci & Musso, in press), the 2-factor model seemed to offer an adequate explanation of the data. These outcomes provided evidence for the structural validity of the scale and confirmed the adequacy of the hypothesized factor structure.
Reliability analyses showed internal consistency measures close to the generally accepted least lower bound, perhaps suggesting heterogeneity in the measured subscales. However, although the value of .80 is appropriate for cognitive tests, for typical performance tests a cut-off point of .70 is more suitable. In particular, when dealing with personality tests and purpose of research, values below even .70 can, realistically, be expected (Kline, 1999; Nunnally & Bernstein, 1994; Traub, 1994). Nonetheless, general guidelines need to be used with caution because the value of alpha depends on the number of items on the scale. More importantly, alpha coefficients should be interpreted as a statistical measure of how well a set of items are interrelated, and not as indicators of unidimensionality (Hattie, 1985). The dimensions (TAS/Dis) appear to be moderately correlated, and may reflect distinct aspects of sensation seeking.
Regarding the construct validity investigation, in accordance with other studies (Weyers, Krebs, & Janke, 1995; Zuckerman, 1983), Impulsiveness (I) is related to Disinhibition (Dis), whereas the Venturesomeness (V) dimension seems to be more strongly associated with both the Thrill and Adventure Seeking (TAS) and Disinhibition (Dis) subscales. According to Claes, Vertommen, and Braspenning (2000), the relationship between Venturesomeness and Thrill and Adventure Seeking is specifically related to the sense of adventure and the practice of extreme sports. This relationship does not include the Impulsiveness dimension, which represents a “dysfunctional” aspect that refers to the inability to reflect on the consequences of one’s actions (Eysenck, 1993), and denotes the lack of self-control or deficiencies in response inhibition (Steinberg et al., 2008). Gomà-i-Freixanet (1991) used the Impulsiveness and Venturesomeness scales to investigate the personality of who engaged in dangerous sports. Although the Venturesomeness scale is able to discriminate individuals practicing extreme sports from non-practitioners, the Impulsiveness scale does not seem to distinguish these two groups.
Although promising, the current findings should be interpreted with caution, suggesting a careful use of this measure in the Italian-speaking population. This research, in fact, is not without important limitations. Despite this initial adaptation of the Sensation Seeking Scale - Form V suggests that it seems both a reliable and a valid measure of sensation seeking, some important points indicate areas that require future research. First, the current study only examined the scale in relation to another self-report instrument and did not include behavioral or experimental correlates. For example, support for the construct validity of the questionnaire might include discriminant validity studies to explore the relationships between the sensation seeking domains and drug use, alcohol consumption, sexuality, extreme sports, driving and public transportation violations. Second, the generalizability of our findings is limited by our recruitment of only university and high school students. Thus, the next goal will be to obtain a relatively heterogeneous group of participants rather than only groups of students.
In summary, the results of these studies suggest that the scale may be a viable version for future use or may at least be a starting point for further revisions of the measure. However, the psychometric properties of the instrument should be carefully examined across additional independent samples to confirm whether our finding is sample specific or more wide-ranging. Older and non-student samples should be investigated in order to determine whether the instrument can be of greater general use.