Introduction
The term psychosis is understood as a cluster of disorders, characterised by psychotic symptoms that alter a person’s perception, thoughts, affect, and behaviour. The course of psychosis varies from person to person but is often characterised by relapse. A psychotic relapse is a recurrence of positive psychotic symptoms such as hallucinations, delusions, and behavioural disturbances, which are of clinical significance, persist for a sustained period of time, and follow a period of partial or full remission. Relapse prevention in psychosis is important because a relapse is potentially highly distressing for the client and their family, threatens to interrupt psychosocial recovery, increases the risk of treatment resistance (Wiersma, Nienhuis, Slooff, & Giel, 1998), and is associated with economic burden for individual families and the wider community because of increased costs of treatment (Almond, Knapp, Francois, Toumi, & Brugha, 2004). The negative impact of psychosis means that the continuing development and evaluation of new treatments is of great importance.
The stress-vulnerability model (Zubin & Spring, 1977) suggests that individuals have different levels of vulnerability or predisposition to certain symptoms, difficulties or illnesses (biological or psychological). This vulnerability interacts with the level of stress to which the individual is exposed, potentially leading to a psychotic episode. While symptoms of psychosis often improve with medication, there are limitations such as incomplete long-term effectiveness and non-adherence (Weiden et al., 1994; Yamada, Barrio, Morrison, Sewell, & Jeste, 2006). The stress-vulnerability hypothesis and emerging support for the impact of environmental and social factors on the disorder illustrates the need for a multimodal intervention strategy in order to optimise treatment (Hultman, Wieselgren, & Öhman, 1997).
People diagnosed with schizophrenia commonly experience feelings of hopelessness (Bassman, 2000; Bengtsson-Tops & Hansen, 1999; Brekke & Long, 2000; Rooke & Birchwood, 1998). Hopelessness is a cognitive-affective state in which the person perceives the disorder and its consequences to be beyond their control, feels helpless, and has given up expecting to influence its course positively, thereby abandoning responsibility and active coping strategies (Hoffmann, Kupper, & Kunz, 2000). People experiencing psychosis and hopelessness are also less likely to pursue their goals (Hoffmann et al., 2000; Lecomte et al., 1999). They have been shown to expect rejection by others and may have a sense that there is little point in persisting in the face of challenge (Roe, 2003). Hopelessness in people with a diagnosis of schizophrenia has also been shown to affect social and occupational dysfunction (Davis, Nees, Hunter, & Lysaker, 2004; Hoffmann et al., 2000).
Hope has been identified as a key factor in recovery from mental illness (Noordsy et al., 2002; Salyers & Macy, 2005), and hopelessness as a key mediating cognitive characteristic between depression and suicide intent and behaviour (Weishaar & Beck, 1992). Therefore, it is important to consider hopelessness in relation to people experiencing psychosis, because they also have an increased risk of suicide (Harris & Barraclough, 1997). Between 20% and 40% of people diagnosed with schizophrenia attempt suicide (Pompili et al., 2007) with the lifetime suicide risk estimated at 4.9% (Palmer, Pankratz, & Bostwick, 2005). Methods used are often violent and lethal (Harkavy-Friedman et al., 1999; Hunt et al., 2006), and even relatively modest levels of hopelessness have been found to predict attempted suicide in people diagnosed with psychosis (Klonsky, Kotov, Bakst, Rabinowitz, & Bromet, 2012).
However, the perceived control that a person believes that they have over their illness appears to be a mediator between the experience of psychosis and depression (Birchwood, Mason, MacMillan, & Healy, 1993). Perceived control is ‘the belief that one can determine one’s own internal states and behaviour, influence one’s environment and/or bring about desired outcomes’ (Wallston, Wallston, Smith, & Dobbins, 1987, p. 5) and is of importance for well-being, quality of life, and functioning in severe mental illness (Bengtsson-Tops, 2004; Eklund, Bäckström, & Hansson, 2003). Birchwood et al. (1993) found that the perception of clients with psychosis about the controllability of their illness powerfully predicted whether they would be depressed. In addition, perceived control over illness has been linked to the likelihood of relapse. Gumley and Power (2000) found that the most frequent thoughts reported by clients were fears of hospitalisation and its consequences. These fears triggered strong emotional responses, which in turn fuelled thoughts and accelerated relapse (Gumley & Power, 2000).
Given these findings highlighting relationships between depression, suicide, hopelessness, perceived control over illness, and relapse in people with psychosis, it is essential that well targeted and timely interventions are delivered and evaluated. The importance of relapse prevention and of providing psychosocial interventions for people with psychosis has long been recognised (Department of Health, 1999; National Institute for Health and Care Excellence, 2009). Many psychosocial approaches to relapse prevention have been described and evaluated, including psycho-education about pharmacological treatments (Herz et al., 2000; Weiden & Glazer, 1997); cognitive-behavioural therapy (Garety et al., 2008; Wykes, Steel, Everitt, & Tarrier, 2008); family interventions (Álvarez-Jiménez, Parker, Hetrick, McGorry, & Gleeson, 2011; Pilling et al., 2002; Pitschel-Walz, Leucht, Bäuml, Kissling, & Engel, 2001); and multi-modal Interventions (Gleeson et al., 2009; Gleeson et al., 2011), which have had varying levels of success and can be costly. Therefore, the development of cheaper, short-term self-management interventions may be important. The development of self-management strategies for relapse prevention has followed research into the potential ability of clients with psychosis to predict their relapse (Birchwood et al., 1989; Jorgensen, 1998; Subotnik & Nuechterlein, 1988). There have been a number of initiatives for clients to develop their own relapse prevention plan, with the aim of increasing their understanding of the course of psychosis and responsibility in developing their own coping strategies to promote independence and hope. Poor perceptions of control over the illness may lead to the individual panicking or failing to act on the occurrence of early signs (Birchwood, Spencer, & McGovern, 2000). Birchwood et al. further suggest that refining the relapse signature and improving the relapse drill increases control over the illness.
A number of relapse prevention self-management strategies have been developed (Copeland, 1997; Plaistow & Birchwood, 1996; Smith, 2001); however, relatively few have been reviewed with this population. Based on his ‘Relapse prevention in bipolar disorder’ manual (Sorensen, 2006a), Sorensen (2006b) developed a manual-based intervention and handbook ‘Relapse Prevention in Schizophrenia and other Psychoses’, designed to reduce hopelessness and enhance ability to control internal states. The intervention draws on the stress-vulnerability model (Nuechterlein & Dawson, 1984; Zubin & Spring, 1977) in describing the development and relapse into schizophrenic episodes. The emphasis on biological vulnerability or stress factors has varied across approaches to treatment, but with approximately 85% of people diagnosed with schizophrenia not having any discernible family history of the disorder (Wahlberg & Wynne, 2001), Sorensen argues that environmental stress factors are important in the expression of psychosis. Sorensen aimed to address the need for effective short-term intervention to prevent relapse in psychosis, with maximum yield at an acceptable cost, suggesting that intervention should provide the client with the ability to take more control of the illness and to become proactive in managing the disorder.
While Sorensen’s (2006a) work on relapse prevention in bipolar disorder has been evaluated and demonstrated significant improvements in suicide risk, perceived control over mood and other internal states, and satisfaction with treatment (Gutierrez, Sorensen, & Tomlinson, 2011; Sorensen, Done, & Rhodes, 2007), his intervention for schizophrenia and other psychoses has not been evaluated to date. The aim of this study, therefore, is to replicate Sorensen’s work on bipolar disorder with a psychosis population, and to test the claims of this short-term intervention via a case series evaluation. The research questions are:
-
Does the short term intervention and use of the handbook reduce hopelessness at 1 week follow up (when compared with baseline) and are any changes maintained at 1 month and 2 month follow up?
-
Does the short term intervention and use of the handbook increase perceived control over internal states at 1 week follow up (when compared with baseline) and are any changes maintained at 1 month and 2 month follow up?
-
Are clients satisfied with the intervention offered?
The research was independently peer reviewed by Keele University. Ethical and research governance approvals were granted by a Local NHS Research Ethics Committee and NHS Trust Research and Development Department.
Method
Recruitment
Participants were recruited via local consultant psychiatrists in the recruitment areas (West Midlands, England). The psychiatrists identified potential participants based on the inclusion and exclusion criteria, and they or the care co-ordinator sent out a letter of invitation and participant information sheet. Potential participants were invited to opt in to the study by contacting the researcher. Following opt-in, an initial meeting with the potential participant was held to discuss the research in more detail. It was explained that participation in the study would involve trialling a previously unevaluated relapse prevention plan and that while it was hoped they would benefit, this could not be guaranteed. Each potential participant was then given a consent form to return by the end of the following week.
Participants
Inclusion and exclusion criteria were designed to optimise ecological validity and not exclude the typical client with psychosis seen in routine secondary care services:
Inclusion Criteria
-
English speaking
-
A known diagnosis of psychosis
-
A willingness to complete homework
Exclusion Criteria
-
Unstable medical problems
-
Acute psychosis at start of treatment
-
Known substance misuse (as assessed by the referring psychiatrist)
-
A known learning disability
-
Major neurological problems
-
An organic mental syndrome/ seizures
All participants who opted in met the inclusion/exclusion criteria. 14 people were recruited to the study but after initial interview, three did not wish to participate. Thus 11 people (7 men and 4 women) completed the intervention. Their ages ranged from 18 to 57 (mean age 31, SD = 12). Other demographic information is given in Table 1.
Table 1
Demographic Information of Participants on Entry to the Study
| Characteristic | N |
|---|---|
| Highest education level achieved | |
| No qualifications | 3 |
| General certificate of secondary education or Ordinary level qualification (GCSE/O levels | 5 |
| Advanced level qualifications (A levels) | 2 |
| First University degree | 1 |
| Accommodation | |
| Rented accommodation | 5 |
| Live with parents | 5 |
| Homeowner | 1 |
| Employment | |
| Unemployed | 8 |
| Paid employment | 0 |
| Voluntary employment | 1 |
| Student | 2 |
| Relationship status | |
| Single | 10 |
| Stable relationship | 1 |
At the end of the study one participant had moved from living with parents to rented accommodation, and one from unemployment into employment. All other demographic information remained constant throughout the study.
Design
This was a pilot study to evaluate the effectiveness of the ‘Relapse Prevention in Schizophrenia and Other Psychoses’ treatment manual (Sorensen, 2006b) using a case series evaluation with no controls, A-A-B-B-C-C-C design (where A = pre-treatment baseline; B = during treatment; C = post treatment follow-up) (see Table 2). Participants completed pre, post and follow-up outcome measures and weekly visual analogue scales (VAS). In addition, participants undertook a ‘pre intervention’ and ‘post-intervention’ interview about aspects of their psychosis and the intervention.
Table 2
Data Collection Points
| Time point | Descriptor of time point | Data collection |
|---|---|---|
| 1 | Baseline: 2 weeks prior to intervention (A) | BHS, CSQ-8, PCOISS |
| 2 | Baseline: 1 week prior to intervention (A) | BHS, CSQ-8, PCOISS, Interview 1, Questionnaire 1 |
| 3 | Following session 1 | Questionnaire 2 (includes VAS) |
| 4 | Following session 2 (B) | BHS, CSQ-8, PCOISS, Questionnaire 2 (includes VAS) |
| 5 | Following session 3 | Questionnaire 2 (includes VAS) |
| 6 | Following session 4 (B) | BHS, CSQ-8, PCOISS, Questionnaire 2 (includes VAS) |
| 7 | Follow up: 1 week post intervention (C) | BHS, CSQ-8, PCOISS, Interview 2, Questionnaire 3 |
| 8 | Follow up: 1 month post intervention (C) | BHS, CSQ-8, PCOISS, Questionnaire 4 (includes VAS) |
| 9 | Follow up: 2 months post intervention (C) | BHS, CSQ-8, PCOISS, Questionnaire 4 (includes VAS) |
Materials
The intervention comprised 4 sessions using the Sorensen (2006b) treatment manual, which incorporates:
-
Psycho-education regarding psychosis; the causes and the influences, the context in which it occurs and the stigma caused by the diagnosis
-
The development of a list of signs and symptoms of psychosis individual to the client
-
The development of an individual psychosis profile (thoughts, behaviours and feelings characteristic of the individual client’s psychotic episodes).
-
The development of a signs and symptoms timeline to determine at what point in the relapse particular symptoms appear
-
The development of a personal list of triggers for relapse into psychosis
-
Determination of personal criteria for when to react to changes in the psychosis profile and development of a list of actions to take
-
Psycho-education regarding how to sleep well
-
Information on the importance of involving family in coping and on adaptive communication skills regarding psychosis
-
The development of a plan for how to manage work situations, including communication with employer.
All 11 participants completed the full treatment programme and were followed up at one week post intervention. Six participants were followed up at one month, and six at two months. However, these were not the same six participants. Only four participants completed outcome measures at all follow-up points.
Measures
Measures comprised standard, validated scales of hopelessness, perceived control over internal states, and client satisfaction:
-
The Beck Hopelessness Scale (BHS) (Beck, Weissman, Lester, & Trexler, 1974). This has been shown to be a reliable measure of hopelessness, reflecting negative expectations for positive future outcomes.
-
The Perceived Control of Internal States Scale (PCOISS) (Pallant, 2000). This was adopted because it assesses the participants’ perceived control over internal states (emotions, thoughts and physical reactions) (permission was given by Pallant to use this measure).
-
The Client Satisfaction Questionnaire (CSQ-8) (Larsen, Attkisson, Hargreaves, & Nguyen, 1979). This has been used in a variety of studies as it supplies a quantitative measure of the participant’s satisfaction with treatment.
In addition, 4 questionnaires were designed, together with a visual analogue scale (VAS). The VAS measured subjective feelings of hopelessness, confidence about ability to control symptoms, and satisfaction with treatment. It was a continuous measure depicted on a horizontal line with end-points in accordance with what is measured (e.g. very hopeless – very hopeful). It has a zero end-point and was measured as a percentage from 0 to 100. Questionnaire 1 included items on participant demographic characteristics, current and past history of mental health, psychosis knowledge, and current treatments. Questionnaire 2 included items about changes to participants’ lives (e.g. job, family, medication, alcohol use), in order to explain or rule out extra-therapeutic confounding factors, and also the VAS. Questionnaire 3 asked questions about psychosis knowledge, attitudes to taking medication, and usefulness of the intervention. Questionnaire 4 included items on ease of understanding and usefulness of the information received, changes to participants’ lives as in Questionnaire 2, use of the handbook, and the VAS. Neither the questionnaires nor the VAS were validated measures and had no established content validity. Raw scores were used and they were not corrected for age or gender.
Procedure
Two weeks prior to the first session, participants were sent and asked to complete the three standard measures (see Table 2) to provide baseline information. One week prior to the intervention, participants attended an appointment during which they were interviewed about their experience of psychosis and their expectations for treatment. They were also asked to repeat the baseline measures, to complete a demographic questionnaire, and to answer questions about their current situation and experiences in relation to psychosis.
The intervention began one week later. Each participant attended four, weekly individual 60 minute sessions delivered by the principal researcher (PB), a final year Trainee Clinical Psychologist with a BSc (Hons) in Psychology, an MSc in Forensic Psychology, and a PGCert in Primary Mental Health. She received weekly supervision. During these sessions, using the Sorensen (2006b) manual, participants were given information about psychosis and helped to develop a personal handbook to help them cope and live with it. Throughout treatment, they were asked to complete the various outcome measures (see Table 2). One week after the final session (Session 4), they were re-interviewed about their experiences with the treatment and about their experience and understanding of psychosis. Follow-up data was also collected during this interview. Further follow-up data was then collected by post one month and two months following completion of the intervention.
Data Analysis
A statistical analysis of the mean differences between pre-treatment and one week follow up, pre-treatment and one month follow up, and pre-treatment and two months follow up was performed with a two-tailed paired-samples t-test as the assumptions of normality were met. It should be noted that running multiple t tests can increase the likelihood of making Type 1 errors; however this procedure rather than using a multivariate test was followed in order to replicate Sorensen’s (2006a) previous work.
There are also two limitations with relying exclusively on group means. Firstly, it ignores individual variability (Barlow, 1981) and for clinicians in routine practice, there is an interest in determining how each individual has responded to the treatment. Secondly, it has been accepted that changes can be statistically significant without being clinically meaningful (Kazdin & Wilson, 1978). In response to these limitations, the Jacobsen-Truax method was developed for defining clinical significance in psychotherapy (Jacobson & Truax, 1991). First, the use of a Reliable Change Index (RC) is proposed to determine if a change is reliable and not due to measurement error. From this one can conclude with a 95% probability (p < .05) that the change is reliable and not the result of an unreliable measuring instrument. Secondly, the client’s score at post-treatment must lie within the normal population range, rather than within the dysfunctional population range, for a clinically significant change to be said to occur. The Reliable Change score was calculated for participants in this study.
Baseline Stability of Measures
Baseline stability of the BHS, PCOISS and CSQ-8 was established by paired samples t-tests comparing the measurement points two weeks and one week before the intervention. A high degree of stability was found between these pre-intervention measurements, with BHS two-weeks pre-intervention scores (M = 8.36, SD = 5.41) and BHS one-week pre-intervention scores (M = 8.18, SD = 6.82), resulting in a non-significant t-test (t(10) = -.289, p = .779). For the PCOISS scores at two-weeks pre-intervention (M = 59.6, SD = 15.4) and at one-week pre-intervention (M = 57.6, SD = 14.3) a non-significant mean difference was found (t(10) = 2.10, p = .062) showing stability of baseline measurement. Equally for the CSQ-8 scores at two-weeks pre-intervention (M = 25.8, SD = 4.92) and at one-week pre-intervention (M = 24.9, SD = 4.35) a non-significant mean difference was found (t(10) = 1.66, p = .127) showing stability of baseline measurement. In the following results, the mean of the two baseline measurements are used to provide the most accurate basis for comparison with post-intervention scores.
Results
Hopelessness
When comparing the mean baseline BHS score (M = 8.27, SD = 6.07) with the measurement taken one week post intervention (M = 2.09, SD = 2.70) a significant reduction in hopelessness was found (t(10) = 4.35, p = .001, Cohen’s d = 1.32). However, when comparing the results derived from the hopelessness VAS measure at the start of intervention (M = 31.2, SD = 23.2) with 1 week follow-up (M = 23.6, SD = 16.9) these findings were not supported (t(10) = 1.70, p = .120, d = 0.37). See Figure 1.
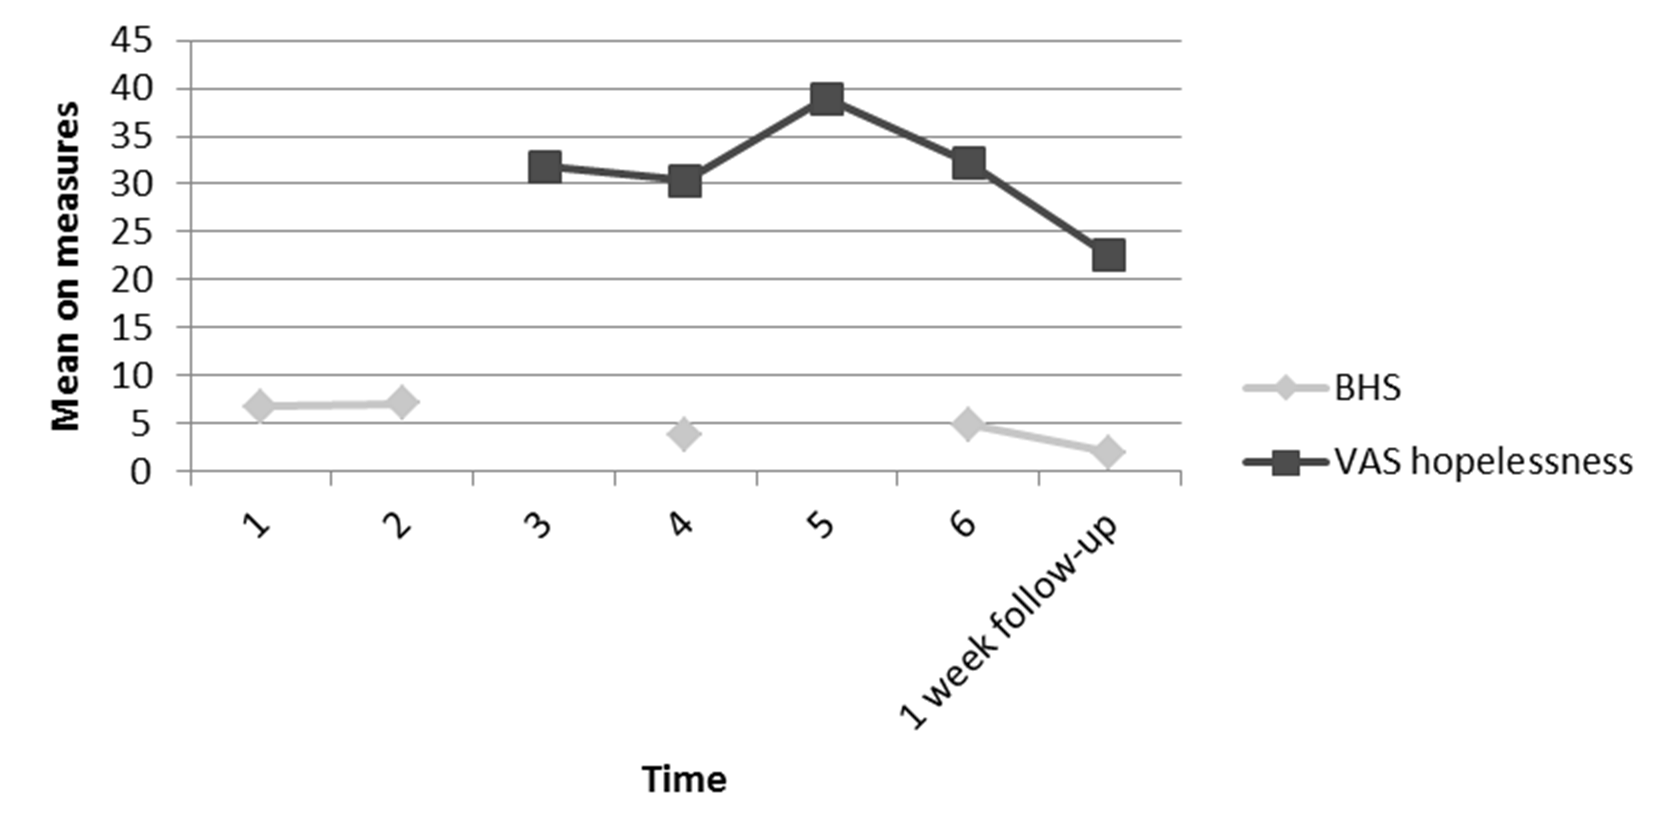
Figure 1
Mean scores for the 11 participants on the BHS and the VAS for hopelessness taken at each time point up to 1 week follow-up.
When comparing the mean baseline BHS scores (M = 6.42, SD = 5.66) for the 6 participants who returned the follow-up data at 1 month (M = 4.00, SD = 4.34) the effect was not maintained (t(5) = .755, p = .484, d = .48). When comparing the results derived from the hopelessness VAS measure at the start of intervention (M = 24.0, SD = 11.4) with 1 month follow-up (M = 26.7, SD = 17.1) these findings (t(5) = -.39, p = .717) showed a small effect size (d = -.19). See Figure 2.
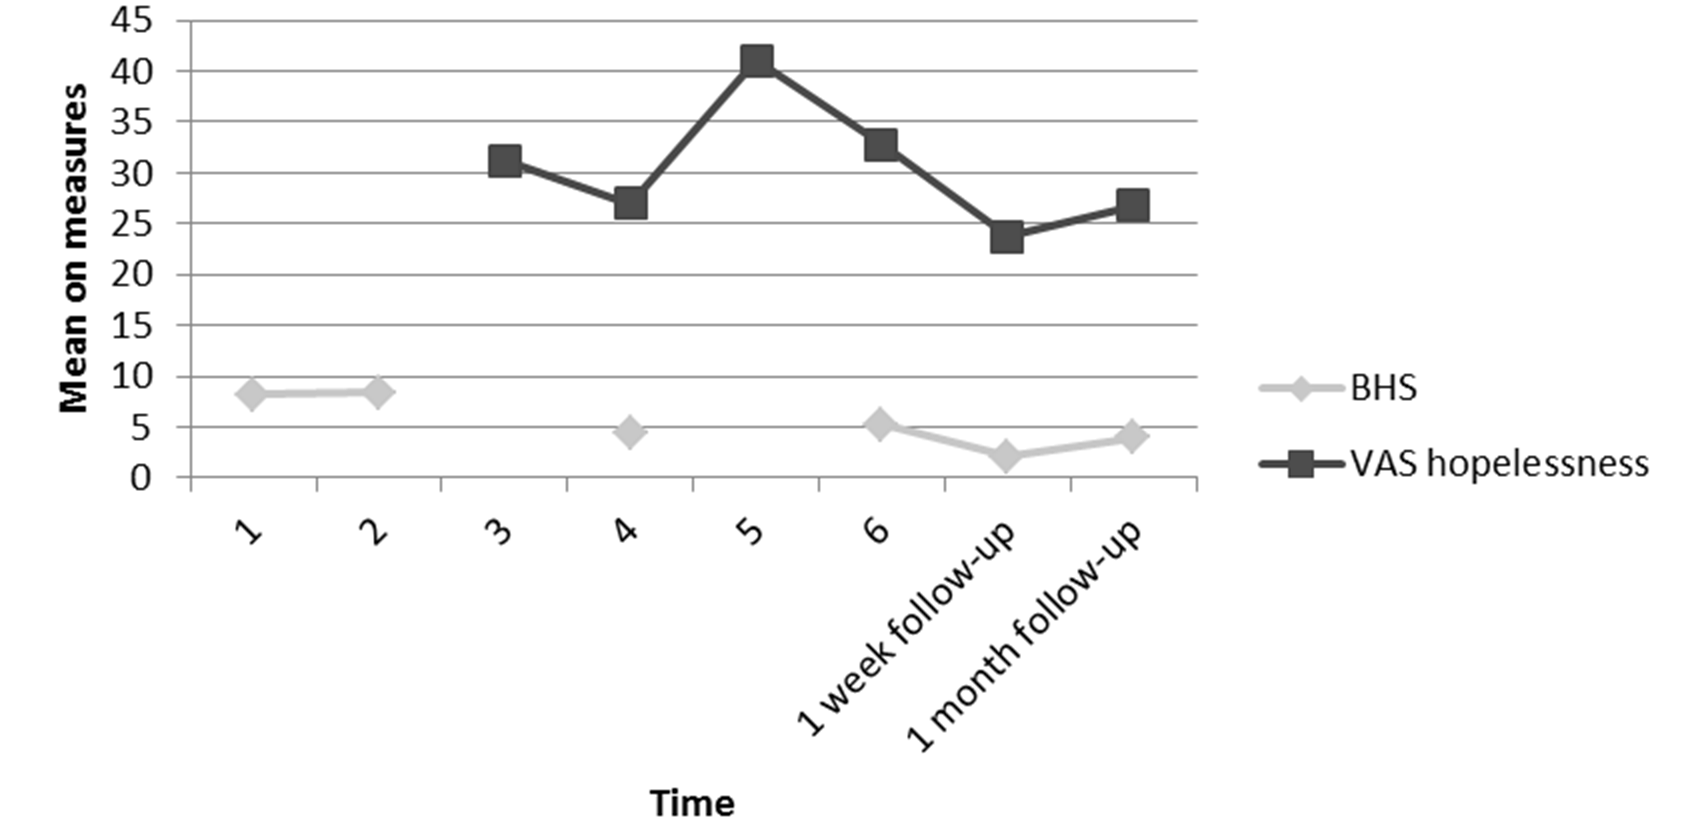
Figure 2
Mean scores for the 6 participants on the BHS and the VAS for hopelessness taken at each time point up to 1 month follow-up.
When comparing the mean baseline BHS scores (M = 5.50, SD = 3.85) for the 6 participants who returned the follow-up data at 2 months (M = 7.50, SD = 7.97) the effect was again not maintained (t(5) = -1.02, p = .357) and there was a small effect size (d = -.32). Results comparing the results derived from the hopelessness VAS measure at the start of intervention (M = 32.3, SD = 22.3) with 2 month follow-up (M = 43.8, SD = 18.4) support these findings (t(5) = -2.46, p = .057) with a medium effect size (d = -.56). See Figure 3.

Figure 3
Mean scores for the 6 participants on the BHS and the VAS for hopelessness taken at each time point up to 2 month follow-up.
As the six participants who completed measures at one month and two months post intervention were not the same individuals, Figure 4 shows the mean scores for the 4 participants who were represented at all follow up points.
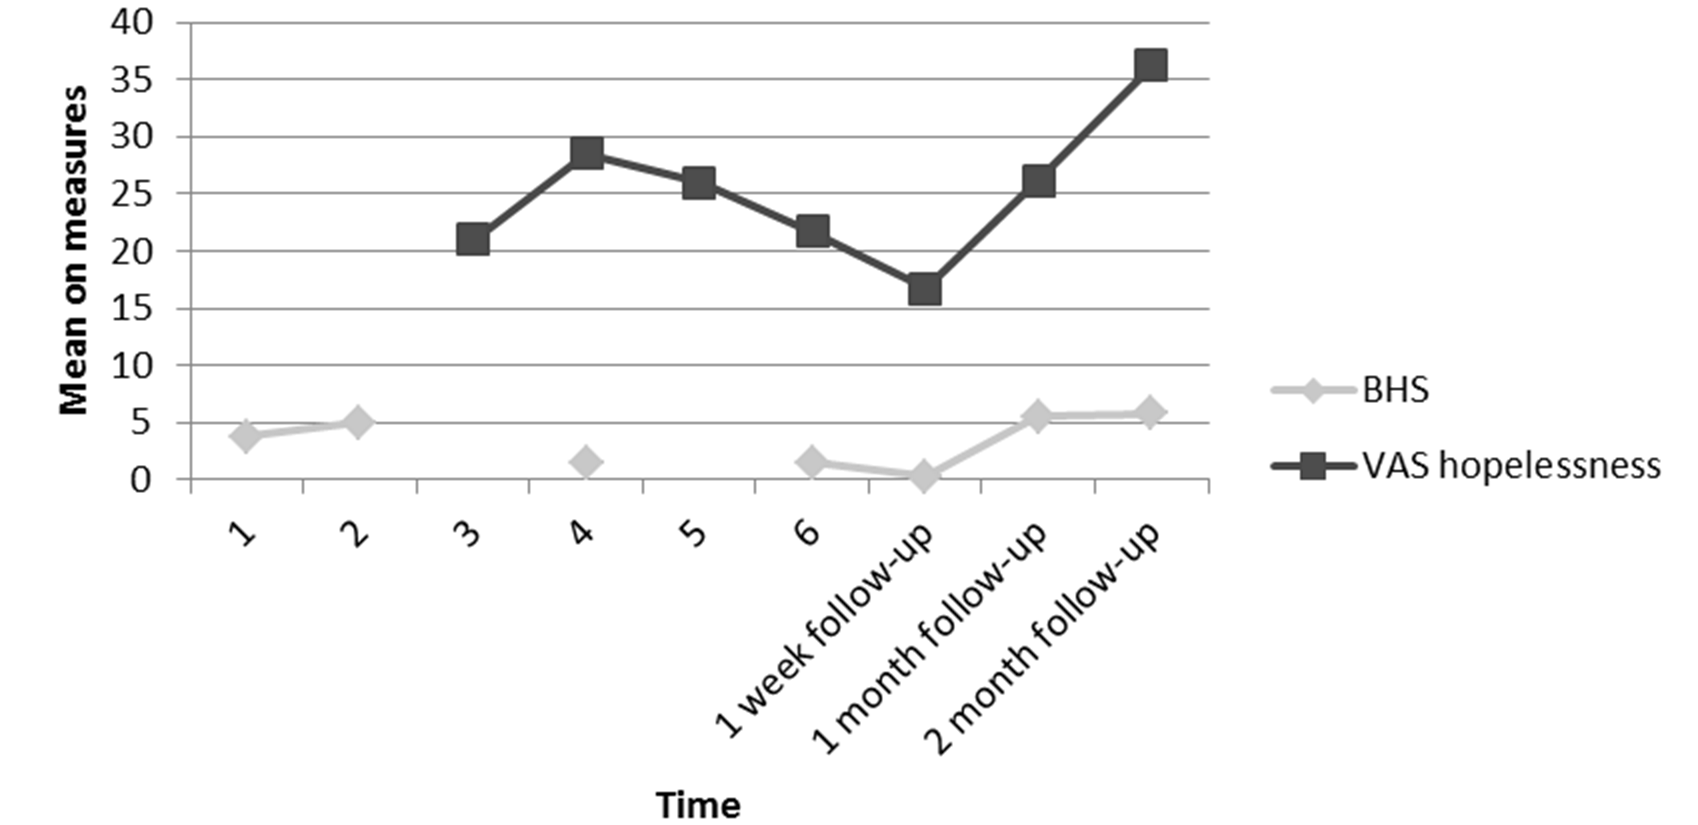
Figure 4
Mean scores for the 4 participants who were followed up on the BHS and the VAS for hopelessness taken at each time point up to 2 month follow-up.
Perceived Control of Internal States
Measures of perceived control over internal states were obtained using the PCOISS, the relevant VAS and interview data. When comparing the mean baseline PCOIS score (M = 58.5, SD = 14.8) with the measurement taken one week post intervention (M = 68.0, SD = 12.5) a significant increase in perceived control over internal state was found (t(10) = -3.22, p = .009) with a medium effect size (d = -0.69). Results comparing the perceived control over symptoms VAS measure at start of intervention (M = 54.3, SD = 25.1) with 1 week follow-up (M = 71.6, SD = 14.3) support these findings (t(10) = -4.23, p = .002, d = -.95). See Figure 5.
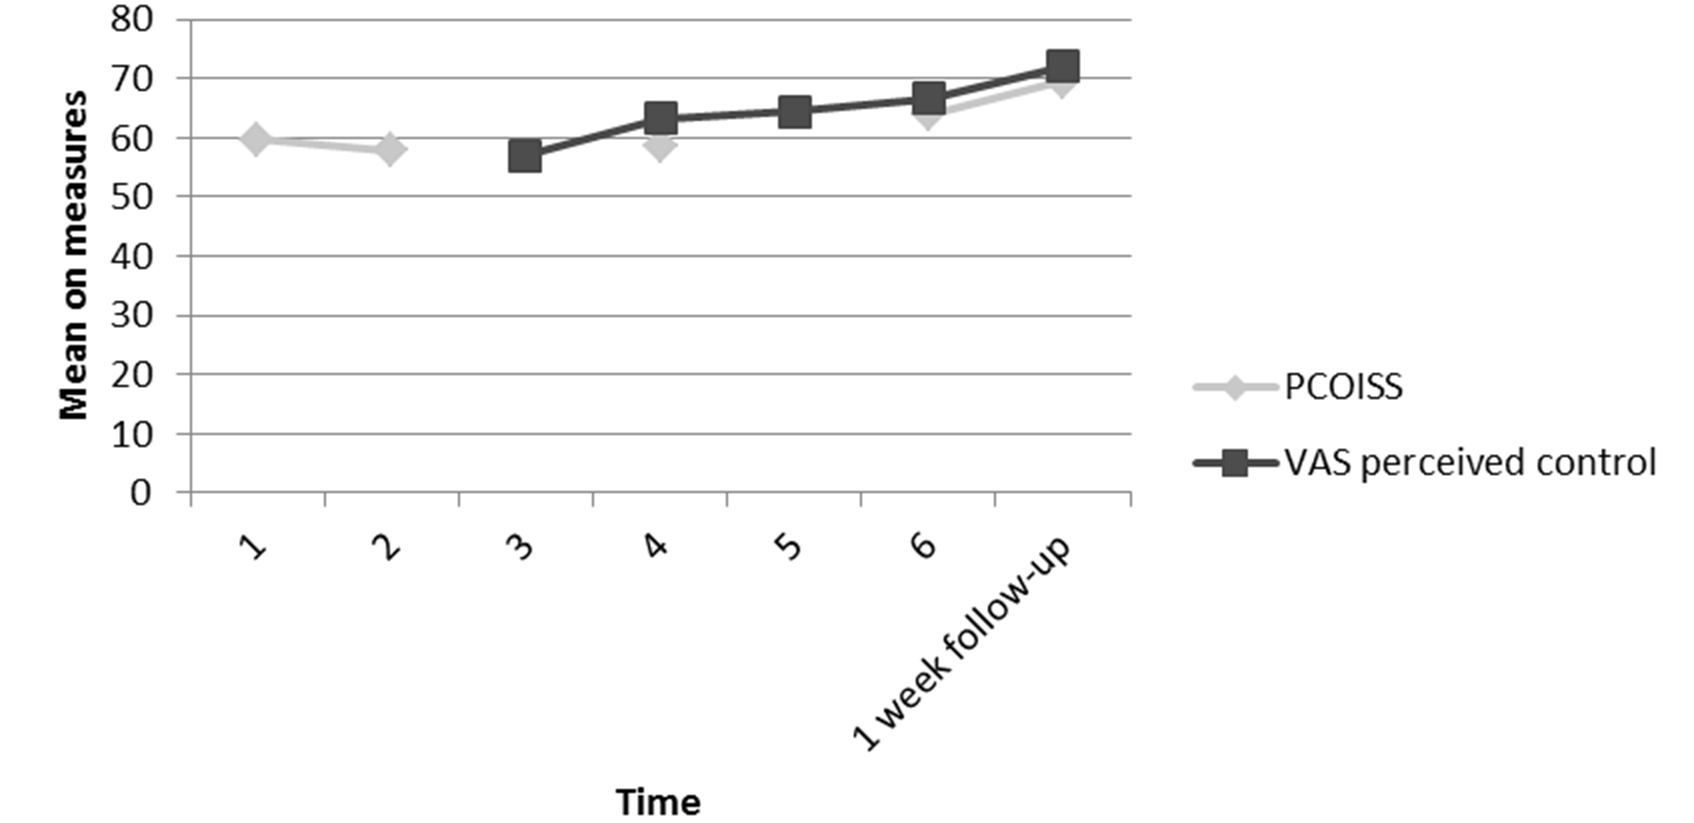
Figure 5
Mean scores for the 11 participants on the PCOISS and the VAS for perceived control over symptoms taken at each time point up to 1 week follow-up.
When comparing the mean baseline PCOISS scores (M = 55.2, SD = 14.4) for the 6 participants who returned the follow-up data at 1 month (M = 67.8, SD = 12.0) the effect was not maintained (t(5) = -.201, p = .101, d = .96). Results comparing the perceived control over symptoms VAS measure at the start of intervention (M = 62.5, SD = 24.2) with 1 month follow-up (M = 67.1, SD = 28.6) support these findings (t(5) = -.615, p = .566) with a small effect size (d = -.17). See Figure 6.
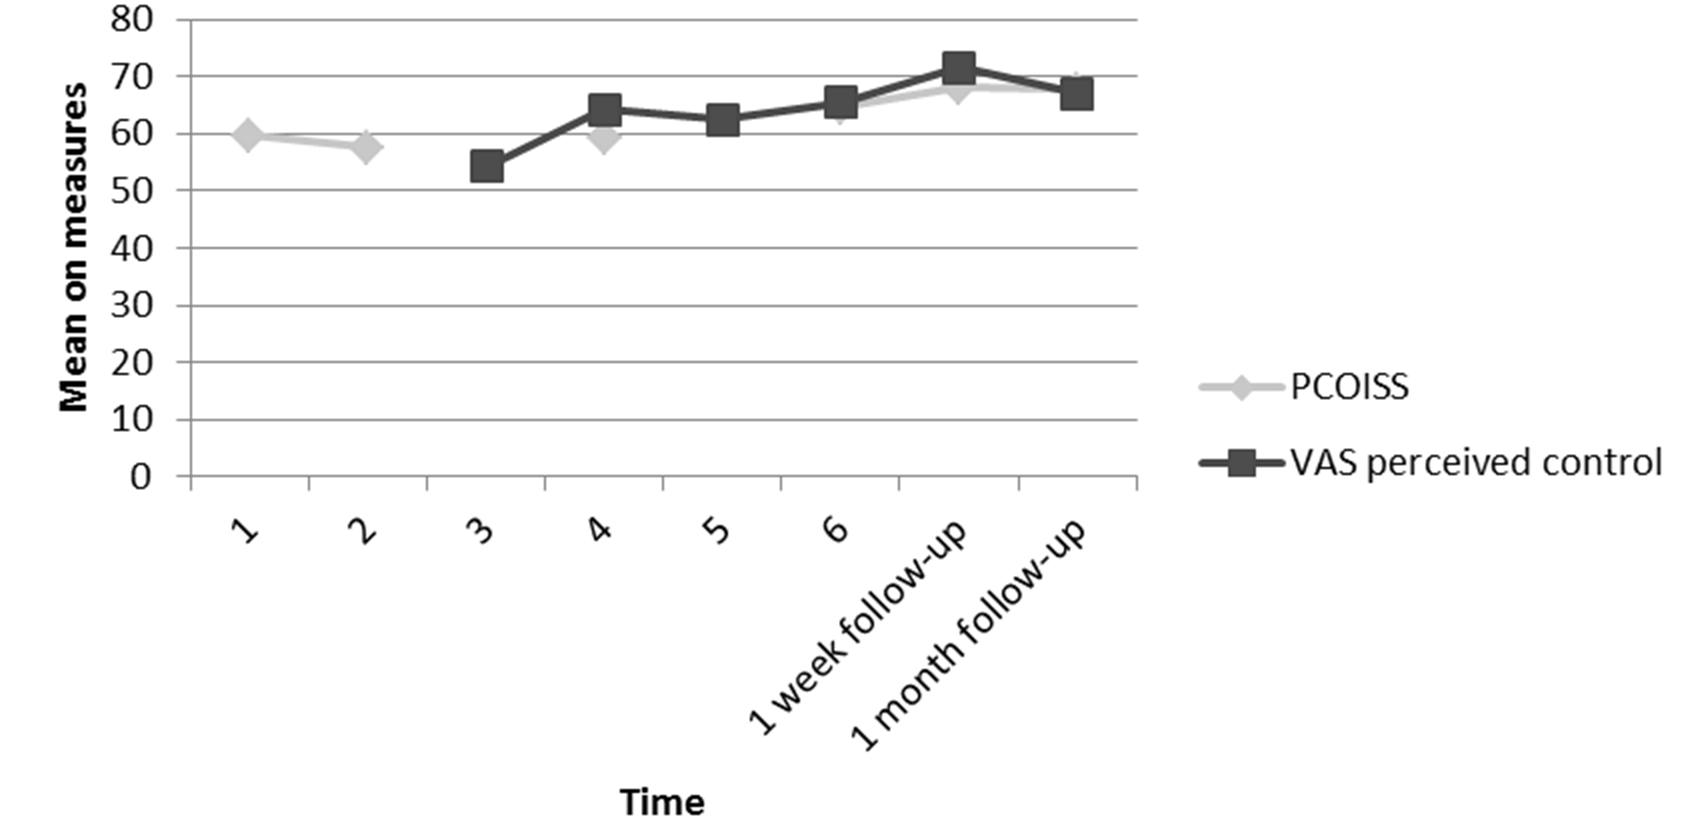
Figure 6
Mean scores for the 6 participants on the PCOISS and the VAS for perceived control over symptoms taken at each time point up to 1 month follow-up.
When comparing the mean baseline PCOISS scores (M = 58.7, SD = 11.6) for the 6 participants who returned the follow-up data at 2 months (M = 59.5, SD = 17.5) the effect was again not maintained (t(5) = -.304, p = .774, d = -.05). Results comparing the perceived control over symptoms VAS measure at the start of intervention (M = 59.6, SD = 26.0) with 2 month follow-up (M = 58.3, SD = 19.9) support these findings at 2 month follow-up (t(5) = .269, p = .799, d = .06). See Figure 7.
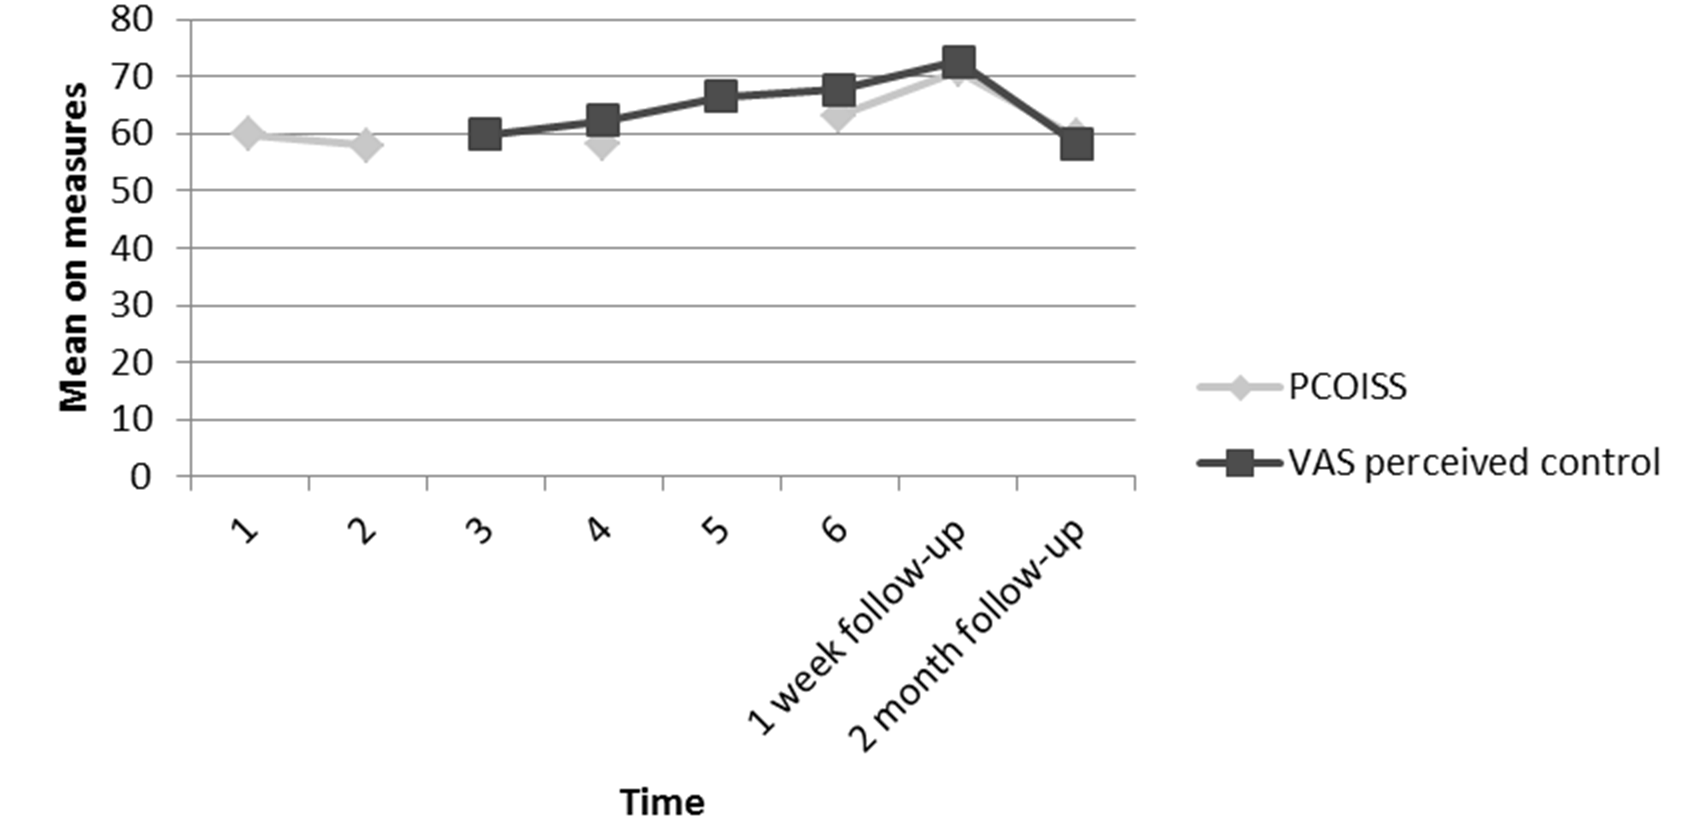
Figure 7
Mean scores for the 6 participants on the PCOISS and the VAS for perceived control over symptoms taken at each time point up to 2 month follow-up.
As the six participants who completed measures at one month and two months post intervention were not the same individuals, Figure 8 shows the mean scores for the 4 participants who were represented at all follow up points.
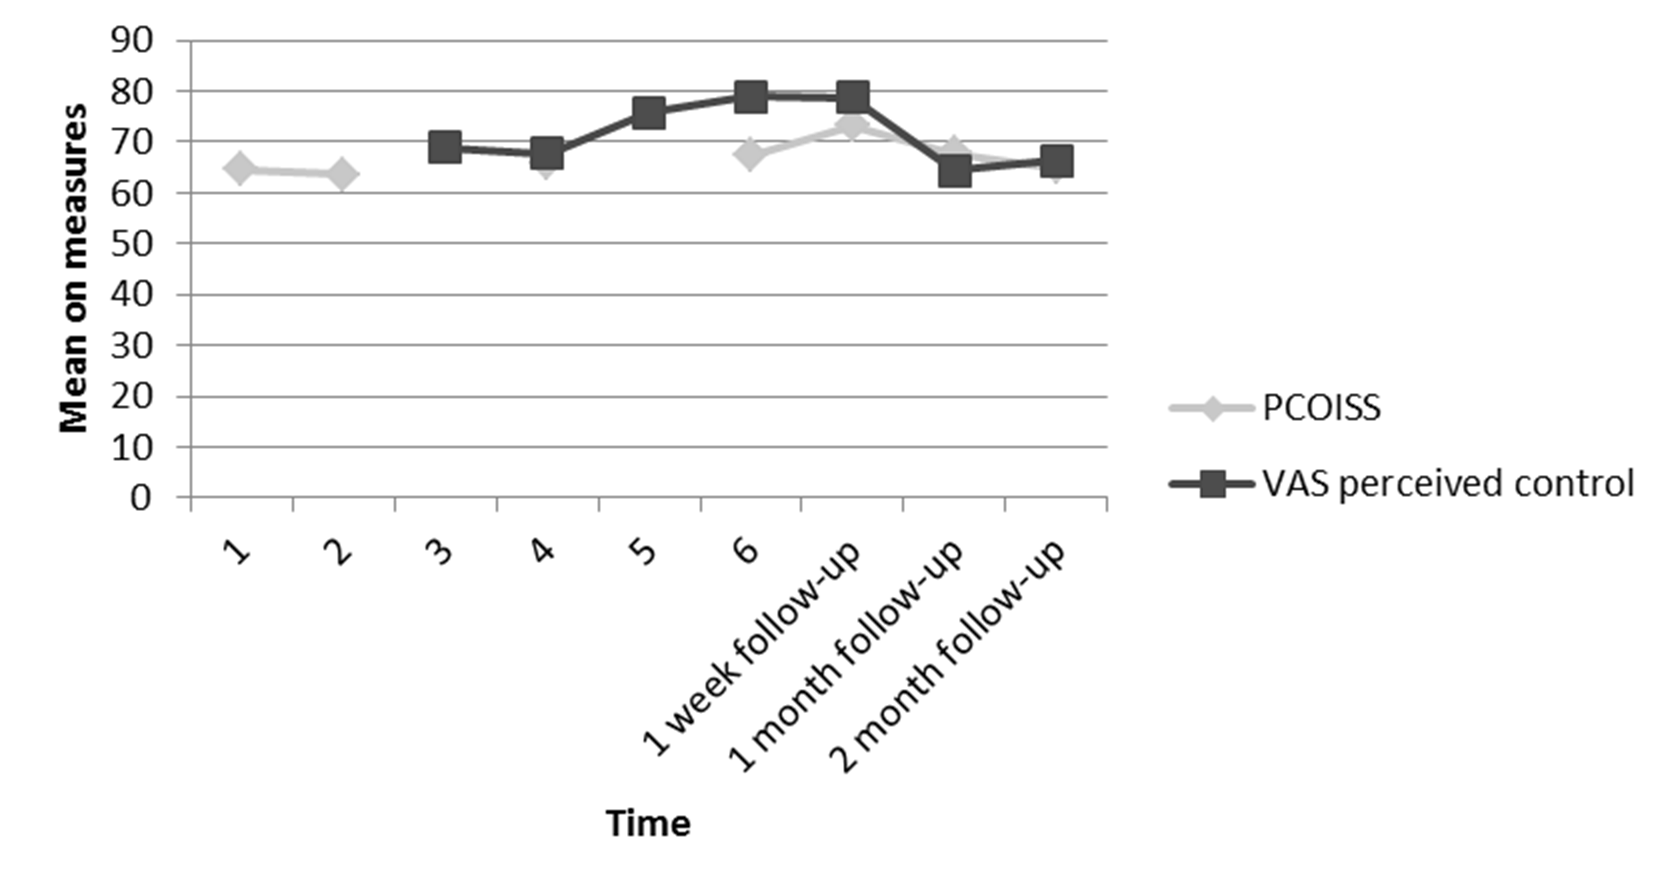
Figure 8
Mean scores for the 4 participants who were followed on the PCOISS and the VAS for perceived control over symptoms taken at each time point up to 2 month follow-up.
Satisfaction and Perceived Usefulness of the Intervention
The results reported above justify the conclusion that the relapse prevention intervention can effect positive change in hopelessness and perceived control over internal states, but in order to be a useful strategy in daily NHS practice the intervention must also be resistant to high dropout rates. None of the participants that began the intervention sessions dropped out, which may in itself indicate a level of satisfaction with the intervention offered. Measures of satisfaction were also obtained using the CSQ-8, the relevant VAS, and through the interviews. When comparing the mean baseline CSQ-8 score (M = 25.4, SD = 4.55) with the measurement taken one week post intervention (M = 28.6, SD = 3.88) a significant increase in satisfaction with services is found (t(10) = -4.38, p = .001, d = 0.70). Results comparing the satisfaction VAS measure at the start of intervention (M = 72.5, SD = 17.5) with 1 week follow-up (M = 71.1, SD = 19.6) do not support these findings (t(10) = .332, p = .747, d = .08). However, at one week follow up, 8 people scored in the high satisfaction range (27–32) and 3 in the medium satisfaction range (21-26) as defined by Larsen et al. (1979). See Figure 9.
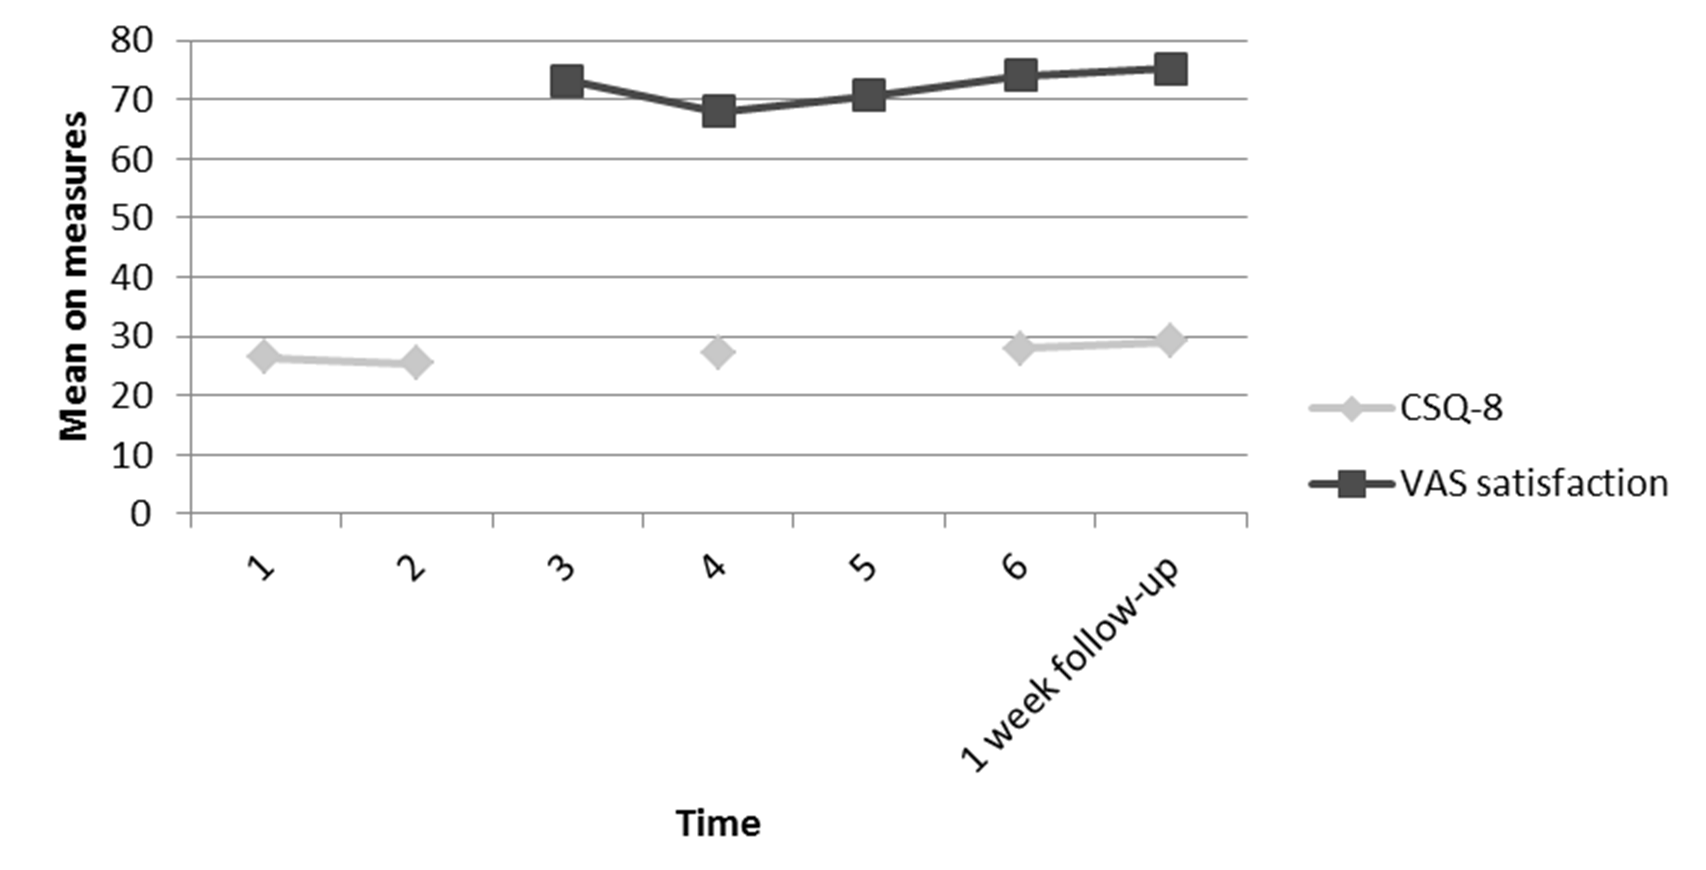
Figure 9
Mean scores for the 11 participants on the CSQ-8 and the VAS for satisfaction taken at each time point up to 1 week follow-up.
When examining interview data at 1 week follow-up, 9 people indicated satisfaction with the intervention. For example:
“Interviewer: Did treatment meet your expectations?
Participant 2: Yes and more. I didn’t expect it to be good at all, I didn’t. I thought it was going to be like rubbish or a waste of time or something that wasn’t going to do me any good. And like it really has been interesting and good, from having the care and starting to work on the problem.”
When comparing the mean baseline CSQ-8 scores (M = 26.1, SD = 5.13) for the 6 participants who returned the follow-up data at 1 month (M = 29.2, SD = 2.40) the effect was not maintained (t(5) = -1.62, p = .165). Results comparing the satisfaction VAS measure at the start of intervention (M = 78.8, SD = 11.9) with 1 month follow-up (M = 80.4, SD = 11.9) support these findings (t(5) = -.334, p = .751, d = -.13). However, 1 month follow-up satisfaction scores found that 5 people scored in the high satisfaction range and 1 scored in the medium satisfaction range. See Figure 10.

Figure 10
Mean scores for the 6 participants on the CSQ-8 and the VAS for satisfaction taken at each time point up to 1 month follow-up.
When comparing the mean baseline CSQ-8 scores (M = 26.4, SD = 3.54) for the 6 participants who returned the follow-up data at 2 months (M = 26.2, SD = 3.55) the effect was again not maintained (t(5) = 3.61, p = .733). Results comparing the satisfaction VAS measure at the start of the intervention (M = 73.8, SD = 14.7) with 2 months follow-up (M = 67.9, SD = 19.1) support these findings (t(5) = 1.35, p = .234, d = .035). At 2 months follow-up, 2 people scored in the high satisfaction range and 4 in the medium satisfaction range. See Figure 11.
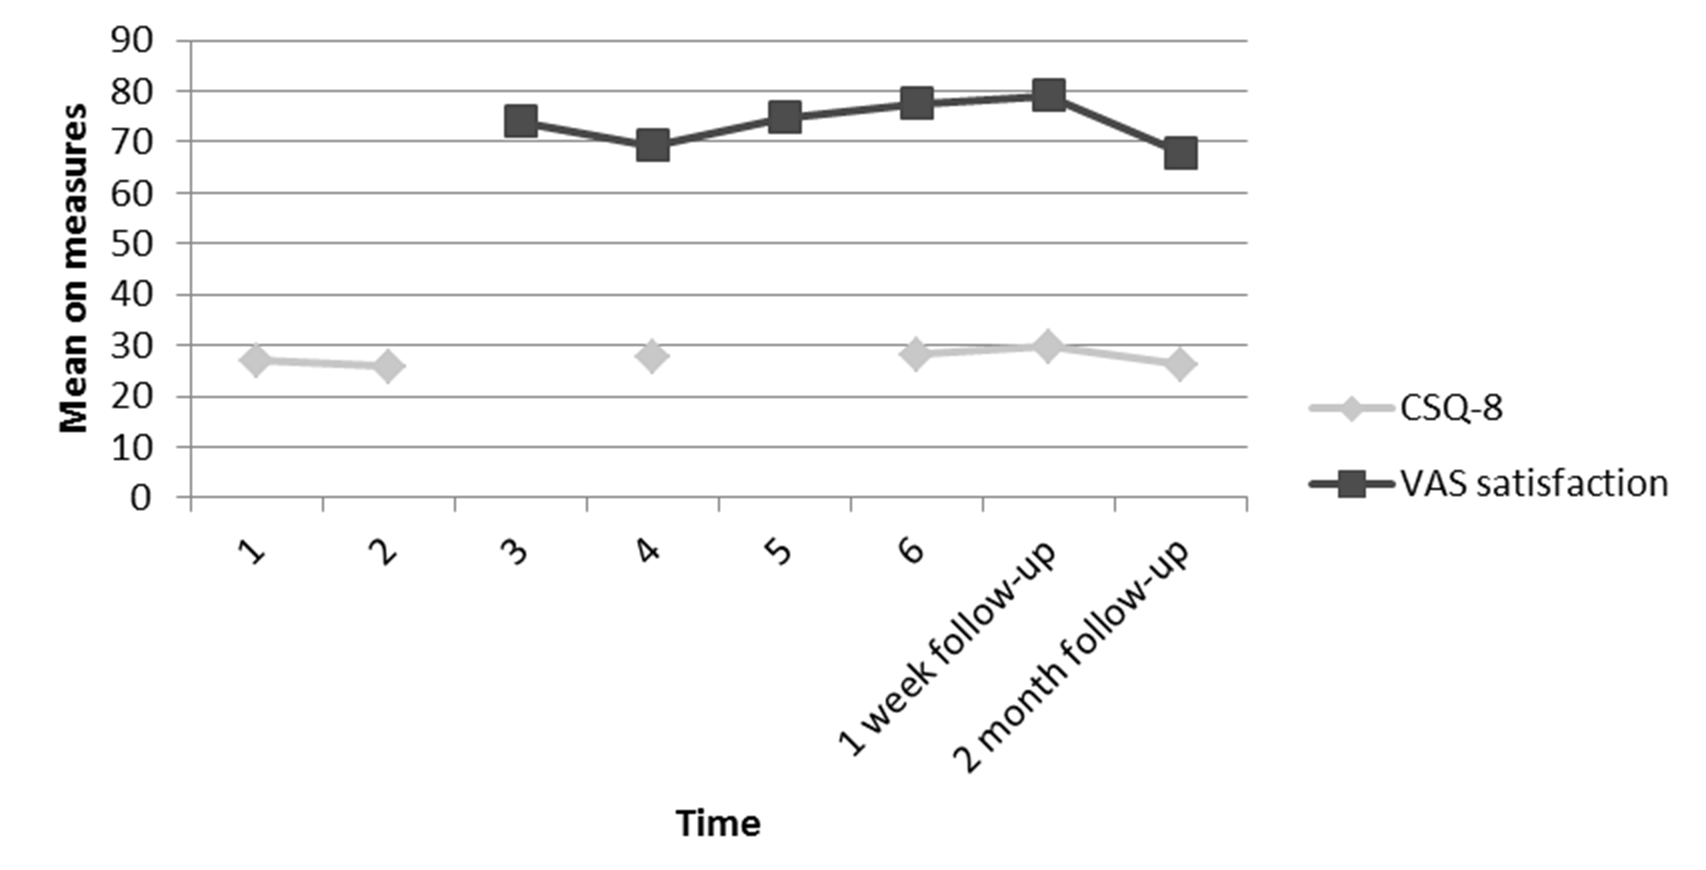
Figure 11
Mean scores for the 6 participants on the CSQ-8 and the VAS for satisfaction taken at each time point up to 2 months follow-up.
As the six participants who completed measures at one month and two months post intervention were not the same individuals, Figure 12 shows the mean scores for the 4 participants who were represented at all follow up points.
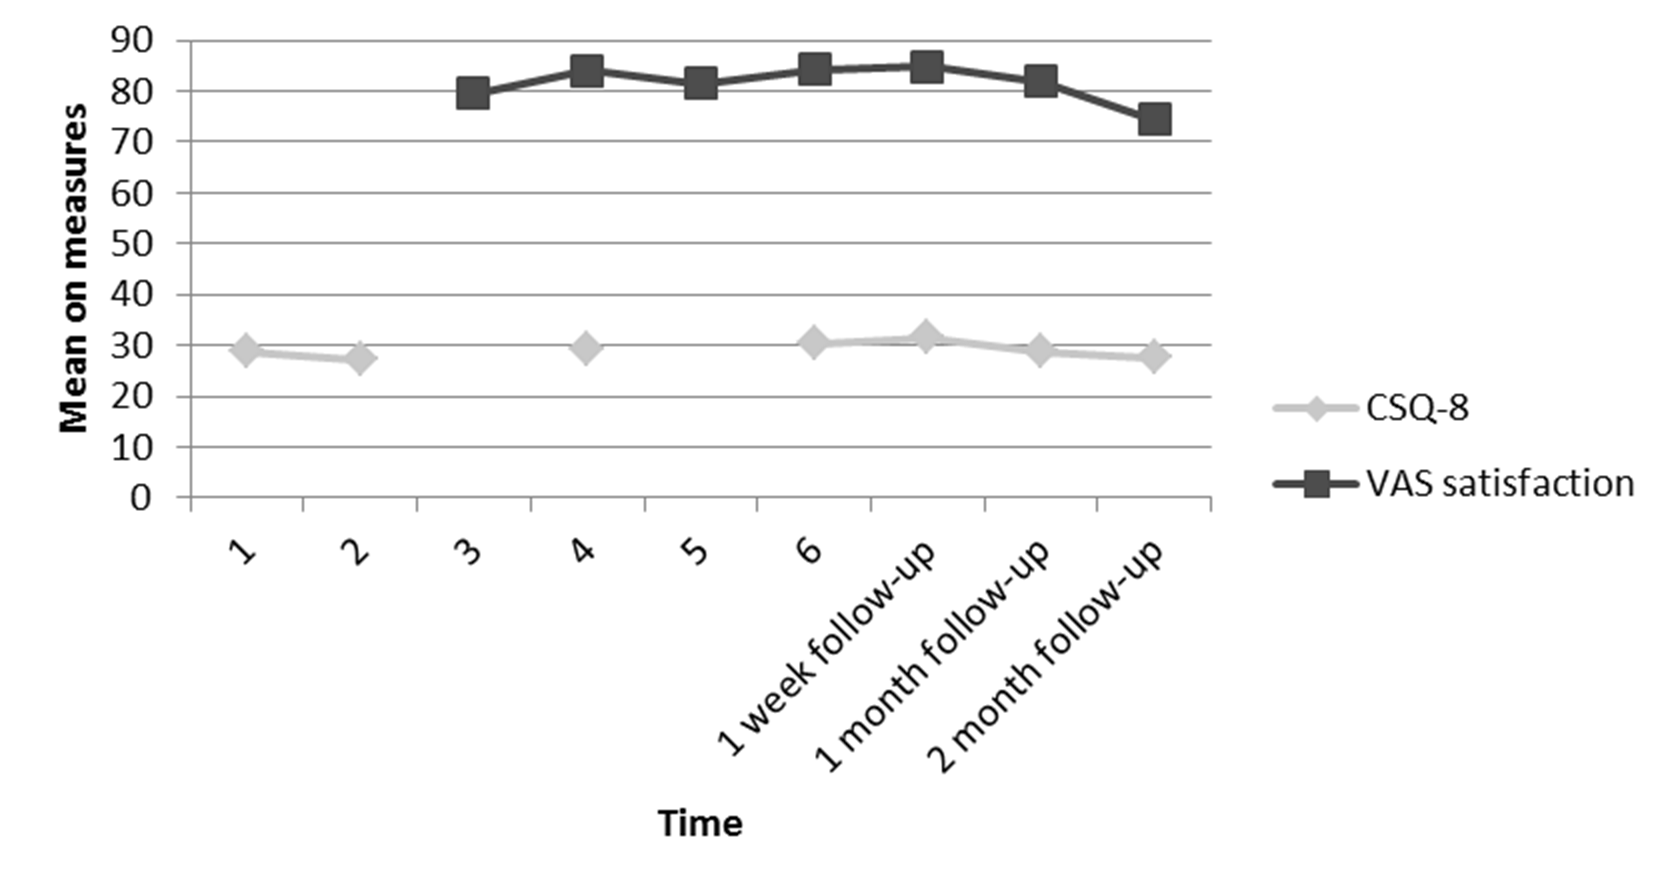
Figure 12
Mean scores for the 4 participants who were able to be followed on the CSQ-8 and the VAS for satisfaction taken at each time point up to 2 month follow-up.
Summary of Findings
As detailed in Table 3, the 95% mean difference confidence intervals enables us, despite the small n, to conclude with some confidence that at 1 week follow-up the differences in mean scores are significant. The confidence intervals at 1 month and 2 month follow-up are comparatively large and further data collection is required for follow-up.
Table 3
95% Confidence Intervals for the Mean Difference (Md) of the BHS, PCOISS and CSQ-8 at Baseline and Follow-up.
| Baseline to 1 week follow-up | Baseline to 1 month follow-up | Baseline to 2 months follow-up | |
|---|---|---|---|
| BHS | 3.01 ≤ (Md = 6.18)* ≤ 9.35 | -5.81 ≤ (Md = 2.41) ≤ 10.6 | -7.07 ≤ (Md = -2.0) ≤ 3.07 |
| PCOISS | -16.1 ≤ (Md = -9.50)** ≤ -2.92 | -28.9 ≤ (Md = -12.7) ≤ 3.57 | -7.89 ≤ (Md = -.83) ≤ 6.22 |
| CSQ-8 | -4.80 ≤ (Md = -3.18)* ≤ -1.56 | -7.98 ≤ (Md = -3.08) ≤ 1.81 | -1.53 ≤ (Md = .25) ≤ 2.03 |
*p = .001. **p = .009.
Reliable Change
In line with the Jacobson and Truax (1991) methodology, the Reliable Change Index (RC) was calculated for the BHS and PCOISS. Results at 1 week follow-up showed that 8 of the 11 participants who completed the treatment showed a significant improvement in hopelessness as measures by the Beck Hopelessness Scale (BHS). The results also showed that at 1 week follow-up, 5 of the 11 participants showed a significant improvement in perceived control of internal state as measure by the PCOISS. No participants made a significant deterioration on either of the measures at 1 week follow-up.
Of the 6 participants who completed 1 month follow-up data, 4 maintained the significant improvement in hopelessness; 1 participant made a significant deterioration in hopelessness at 1 month follow-up (although having made a significant improvement at 1 week follow-up) and 1 had made no change in hopelessness when compared to the baseline measure. Interestingly, three of the six participants who returned the follow-up measures indicated that they were continuing to use the relapse handbook, and all of these maintained their improvements on the BHS at one month follow-up. With regard to perceived control over internal state at 1 month follow-up, none of the 6 participants showed a significant change compared to the baseline.
Of the 6 participants who completed 2 month follow-up data, 1 maintained the significant improvement in hopelessness, 2 made a significant deterioration in hopelessness (although these participants had made a significant improvement at 1 week follow-up) and 3 had made no change in hopelessness when compared to the baseline measure. Interestingly, two of the six participants who returned the follow-up measures indicated that they were continuing to use the relapse handbook; however, only one of them maintained their improvements on the BHS at two month follow-up. With regard to perceived control over internal state at 2 months follow-up, none of the 6 participants showed significant change when compared to the baseline.
A summary is presented in Table 4 with clients’ scores on the BHS and PCOISS having to show a minimum change of 2.41 and 10.50 points respectively in order to demonstrate either reliable improvement or reliable deterioration depending on the direction of change. The percentages and frequencies of clients achieving reliable change are shown in Table 4. (Subjects were allocated a number from 1 to 11, shown in brackets).
Table 4
Reliable Change Index at 1 Week Follow-up, 1 Month Follow-up and 2 Months Follow-up as Measured by the BHS and PCOISS
| Reliable Change Index | 1 week follow up N = 11 | 1 month follow up N = 6 | 2 month follow up N = 6 |
|---|---|---|---|
| BHS | |||
| Significant improvement | N = 8 (1,2,3,4,5,7,8,9) | N = 4 (4,7,8,9) | N = 1 (8) |
| Significant deterioration | N = 0 | N = 1 (5) | N = 2 (3,5) (see discussion) |
| No significant change | N = 3 (6,10,11) | N = 1 (11) | N = 3 (4,6,11) |
| PCOISS | |||
| Significant improvement | N = 5 (3,6,7,8,11) | N = 0 | N = 0 |
| Significant deterioration | N = 0 | N = 0 | N = 0 |
| No significant change | N = 6 (1,2,4,5,9,10) | N = 6 (4,5,7,8,9,11) | N = 6 (3,4,5,6,8,11) |
At 1 week follow-up, 6 of the 8 participants who showed a reliable change on the BHS confirmed this with statements during interview. For example:
“Interviewer: What changes if any have you noticed in yourself since therapy started?
Participant 8: Well I am feeling quite good, I’ve got hope, like for example yesterday, you know I felt a bit, not depressed but a bit off and I thought shall I go for a drink with my friends and I know it doesn’t agree with me when I’m feeling a bit off so I thought I can remember writing it down in the book, that that’s not good for me, so that’s I probably would have gone if I hadn’t got that in my book. I think that this will keep me in line.”
In relation to perceived control over internal state, at 1 week follow-up, the 5 participants who showed a reliable change on the PCOISS confirmed this with statements during their interview. For example:
“Interviewer: And have you experienced a change in confidence regarding your ability to control your symptoms?
Participant 4: Yes I think so I mean definitely I think I certainly think you know things have come along, issues have come along which I have dealt with so I understand what had happened in the previous way and then better methods of dealing with it because one of the good things about talking about it is you can discuss like coping strategies and say well if this happens I can do this or I can do this, whether its relaxation techniques, exercise, or you know like sleep problems, I know it’s little things, but everyone has problems like that so discussing it with someone and working productively and proactively to figure it out.”
The three people who showed no reliable change as measured by the PCOISS also confirmed this during their interview. A representative example is provided:
“Interviewer: And how confident are you, that you will be able to keep the symptoms of psychosis under control in the future?
Participant 3: Not without medication, not even with medication no I’m not that confident, I mean it’s getting better with the medication but things are still not good”
No participants indicated a deterioration in their perceived ability to control their symptoms.
Return to Normal Level of Functioning
The second condition of the Jacobson and Truax (1991) methodology stipulates that a reliable change will be considered clinically significant only if the client’s score at post-test falls within the normal population range rather than in the dysfunctional population range. In observing norm scores for the measures used it was found that participants’ scores at post-intervention would have to be below 3.28 for the BHS and above 36.6 for the PCOISS for the change to be considered clinically significant.
The number of clients returning to normal levels of functioning, regardless of whether or not the change experienced was reliable, is presented in Table 5. There are some instances when this criterion is not applicable, i.e. when the client’s score at baseline was already within the functional range. This means that no matter how much their scores change in the desirable direction, their change can never be deemed clinically significant, according to the Jacobsen-Truax method. The results indicated that this was the case for 2 of the 11 participants measured by the BHS, and 10 of the 11 participants measured by the PCOISS. With regard to the other participants, of the 9 participants who were not functioning at a normal level with regard to hopelessness prior to intervention, 7 were able to make a positive change back to normal level of functioning at 1 week follow-up, although this was only maintained for 4 participants at 1 month follow-up and 2 participants at 2 months follow-up. The one participant who was not functioning at a normal level with regard to perceived control over internal state prior to intervention did make a return to normal level of functioning at 1 week follow-up and this was maintained at 1 month follow-up. Unfortunately 2 month follow-up data was not available for this participant.
Table 5
Frequency of Participants Showing a Return to Normative Levels of Functioning at 1 Week Follow-up, 1 Month Follow-up and 2 Months Follow-up as Measured by the BHS and PCOISS
| 1 week follow up N = 11 | 1 month follow up N = 6 | 2 month follow up N = 6 | |
|---|---|---|---|
| BHS | |||
| Criteria Achieved | N = 7 (1,4,5,7,8,9,11) | N = 4 (4,7,8,9) | N = 2 (4,8) |
| Criteria Not Achieved | N = 2 (2,3) | N = 2 (5,11) | N = 3 (3,5,11) |
| Criteria Not Applicable | N = 2 (6,10) | N = 0 | N = 1 (6) |
| PCOISS | |||
| Criteria Achieved | N = 1 (9) | N = 1 (9) | N = 0 |
| Criteria Not Achieved | N = 0 | N = 0 | N = 0 |
| Criteria Not Applicable | N = 10 (1,2,3,4,5,6,7,8,10,11) | N = 5 (4,5,7,8,11) | N = 6 (3,4,5,6,8,11) |
Overall Summary of Results
A statistically significant difference for hopelessness, perceived control over internal states and satisfaction scores was found between baseline and one week follow-up. The direction of change was supported by the VAS scales; however, only the VAS for perceived control over internal states produced a statistically significant change at one week follow-up. These statistically significant changes were not maintained on any of the measures at either one or two months follow up. When observing the satisfaction scores, the majority of clients scored in the high satisfaction range at one week and one month follow up; however this decreased to the majority reporting only medium satisfaction at two months follow-up.
The application of the Jacobson-Truax method provides information regarding individual variability and allows individuals to be classified into categorical ratings for clinical improvement. On the hopelessness scale (BHS) 8 out of 11, 4 out of 6 and 1 out of 6 people made a significant improvement at one week, one month and two months follow-up respectively. For the people who were not within the normal level of functioning prior to intervention, 7 out of 9, 4 out of 6 and 2 out of 7 people returned to a normal level of functioning at one week, one month and two months follow-up respectively. On the perceived control over internal states scale (PCOISS) 5 out of 11 people made a significant improvement at one week follow-up but this was not maintained at one month or two months follow-up. For the one person who was not within the normal level of functioning prior to intervention, this person returned to the normal level of functioning at one week and one month follow-up (this person could not be contacted at two months follow-up). These results support the statistical analysis and indicate that the intervention can have a positive effect on hopelessness and perceived control over internal states; however this effect diminished at one month and two months follow-up. On analysis of the questionnaires, no participants reported any extra-therapeutic factors that could have caused the observed changes.
Discussion
The results of this study show that the short term intervention and use of the handbook had the ability to decrease hopelessness and increase perceived control over internal states at one week follow-up as measured by the BHS and PCOISS. These findings are supported with Reliable Change measures showing that the majority of participants showed positive reliable change in hopelessness and had moved to within the normal level of functioning. When observing perceived control over internal states, the Reliable Change measures also supported the results. Just less than half of the participants showed positive reliable change at one week follow-up; however the majority had scored within the normal level of functioning at baseline. This may be why the effect sizes are not as large as for the measure of hopelessness. The findings from the VAS also support the findings of the validated measures (as shown in Figures 1-8) and the pattern of change is very similar. The VAS measuring perceived control produced a statistically significant result; however this was not the case for the VAS measuring hopelessness. As the VASs are not validated measures with an established content validity this may why they have been less sensitive at producing a statistically significant result.
While it is not possible to assume a direct causal relationship between treatment intervention and results, the stability of the measures at baseline, the immediacy of change following the intervention, and the relatively large magnitude of change observed contribute to the argument that the intervention was responsible for the change. On this basis, and because no extra-therapeutic factors of importance were found, it is safe to say that the relapse prevention intervention has effected a significant and positive change in levels of hopelessness and perceived control over internal states at one week follow-up.
Unfortunately, these changes were not maintained at one month follow-up. However the rate of attrition meant that only six participants were followed up, meaning a lack of statistical power. Although there was no statistical significance at one month follow-up, the effect size for the BHS was medium (d = .48) and large for the PCOISS (d = .96). Power calculations using G*Power (Faul, Erdfelder, Buchner, & Lang, 2009) revealed that to reach statistical power at the 0.8 level, the study would have required 35 participants at one month follow-up for the BHS, and 11 for the PCOISS. The pattern of results was supported by the Jacobson-Truax methodology and the VAS scores. When observing hopelessness scores as measured by the BHS, at one month follow up four participants maintained the significant improvement and the same four participants remained within the normal level of functioning range. Unfortunately one participant who had made a significant improvement at one week follow-up had made a significant deterioration at one month follow-up, although in examining the questionnaires it is unclear what may have caused this deterioration. When observing perceived control over internal states as measured by the PCOISS, no participants had maintained their significant improvement at one month follow-up; however the one participant who returned to normal level of functioning at one week follow-up remained within the normal level of functioning range at one month follow-up. When considering results from the Jacobson-Truax methodology along with the medium and large effect sizes, and the reasonable number of participants required to reach statistical power at one month follow-up, it is recommended that this study be replicated with no fewer than 35 participants. It is important to remember that due to the lack of power for the one month follow-up analysis, a statistically insignificant result cannot be presumed to be correct.
Unsurprisingly, the statistically significant results were again not maintained at two months, but again there was a significant attrition rate and only six participants were followed up, meaning a lack of statistical power. However, effect sizes at two months follow-up were small for the BHS (d = -.32) and PCOISS (d = -.05). These results were supported by the pattern of results on the VASs and by the results of the Jacobson-Truax method. The reliable change index showed that one person maintained their significant improvement on the BHS at two months follow-up. Power calculations using G*Power (Faul et al., 2009) revealed that to reach statistical power at the 0.8 level, 71 participants would need to be recruited on the BHS, and 2598 participants would need to be recruited on the PCOISS. Rather than simply advising that the study be replicated with a larger sample, it is suggested that instead, the focus should be on thinking about how the effects observed at one week follow up can be maintained.
Participants showed a statistically significant increase in satisfaction with the intervention as measured on the CSQ-8 at one week follow up. However, this was not maintained at one month and two months follow-up. At one week follow-up 8/11 people scored in the high satisfaction range and 3/11 scored in the medium satisfaction range. Satisfaction was maintained at one month follow-up when 5/6 people scored in the high satisfaction range and 1/6 scored in the medium satisfaction range. At two months follow-up, satisfaction scores decreased slightly but 2/6 people scored in the high satisfaction range and 4/6 scored in the medium satisfaction range. These results indicate that participants were satisfied with the intervention that was offered. The acceptability of the program was also suggested by the zero drop-out rate; all participants that experienced the first treatment session completed the intervention.
Relevance of the Findings and Clinical Implications
The results of this pilot study showed promising effects on hopelessness, perceived control over internal states, and satisfaction over the short-term but the study would require replication on a larger scale to address longer term effects. However, given the importance of the psychological constructs measured in this study, the results do contribute to the existing research into the efficacy of self-management strategies in relapse prevention.
The sense of hopelessness and control that a person with psychosis has over their illness is considered of great importance. The results reported here support the wider research with people with a mental illness which has found that the development of a relapse prevention plan can positively affect hopelessness (Copeland, 1997; Gingerich & Mueser, 2006; Mueser et al., 2006; Roe, Hasson-Ohayon, Salyers, & Kravetz, 2009) and perception of control over the illness (Copeland, 1997; Gingerich & Mueser, 2006; Jumnoodoo, Coyne, & Singaram, 2001; Mueser et al., 2002; Mueser et al., 2006). Research into this area has shown that developing the necessary knowledge and skills can reduce the impact of the mental illness on people’s lives; they can achieve a sense of personal wellness and control over their illness and the development of personally rewarding goals (Copeland, 1997; Gingerich & Mueser, 2006; Mueser et al., 2006; Mueser et al., 2002).
It is proposed that the level of hopelessness and the perception of control that one has over the illness is linked to the likelihood of future relapse. This is because hopelessness is a key mediating factor between depression and suicidal intent and behaviour (Weishaar & Beck, 1992) and the perception of control one has over the illness is a variable mediating between the experience of psychosis and depression (Birchwood, Mason, MacMillan, & Healy, 1993). This could then develop in to a vicious cycle as with each relapse, individuals are more likely to have persistent and distressing psychotic experiences (Wiersma, Nienhuis, Slooff, & Giel, 1998), and to experience loss, depression and hopelessness (Birchwood, Mason, MacMillan, & Healy, 1993). The study demonstrated that participants were satisfied with the intervention and logically a certain level of satisfaction is necessary if the treatment is to possess effectiveness in daily NHS practice.
The main implication of this study is that the positive results obtained on hopelessness and perceived control at one week follow-up, coupled with the fact that this is a very short low-cost intervention requiring little training on the part of the clinician, together with the high levels of acceptability from clients, provide enough support for the short term efficacy of this intervention. Based on the results from follow-up, it is suggested that ‘booster sessions’ could be provided in order to maintain the positive effects.
Limitations and Future Directions
The main limitation of this study was the lack of statistical power at follow-up. As the power calculations suggested very large numbers of participants are required at two month follow up, it is suggested that booster sessions are used and effects tested over longer periods to determine whether or not the results are maintained over a longer course.
A further limitation may be that while participants were made aware that negative or critical views of the treatment were acceptable within the context of researching a new intervention, the person delivering the intervention also scored the measures. Thus anonymity was not possible and may have resulted in participants improving or modifying an aspect of their behaviour in response to the fact that they knew they were being studied. This phenomenon, known as the Hawthorne effect (Parsons, 1974) has been well researched and needs even further investigation (McCambridge, Witton, & Elbourne, 2014). It is recommended that future research employs a researcher to conduct the interviews and collect the outcomes measures who is separate from the person delivering the intervention.
The study cannot provide any evidence that actual relapse was affected in those who participated. However, it does suggest that factors that are likely to be important in the prevention of relapse, namely reduced feelings of hopelessness, greater perceived control of internal states, and high satisfaction with an intervention can be positively affected by that intervention. In addition to longer follow-up periods, a more sophisticated way of measuring relapse is required. A criteria to define relapse that has been used in recent studies has been an exacerbation of positive symptoms present for a minimum 2-weeks, which is accompanied by a change in management (e.g., an increase in antipsychotic medication, or frequency of appointments with the care coordinator/ psychiatrist) within 6 and 12 months of entering the study (Barrowclough et al., 1999; Vasconcelos e Sa, Wearden, & Barrowclough, 2013).
The study employed inclusion and exclusion criteria which may challenge the ecological validity of the results. However, it was considered that these criteria would be similar to those needed to engage a person with psychosis in developing a relapse prevention plan in the real world, and so this was not considered a major weakness. The participants took part as they showed an interest in this type of work, but again there may be a bias in terms of the psychological characteristics of the participants; they may have had a higher level of motivation or insight which may have positively affected the results.
A limitation when evaluating the measure of perceived control over internal states was that the majority of participants did not meet the clinical criteria prior to the intervention. This meant that there was only so much change that the intervention could have affected. In addition, it meant that no matter how much the intervention did affect change, it could not be considered clinically significant when using the Jacobson-Truax methodology and is one of the limitations of this method. This may have had an impact on the apparent efficacy of the study, as Beck-Sander, Griffiths, and Friel (1998) found that participants with a perception of poor sense of control over their illness and poor ability to cope with symptoms at the beginning of an intervention appeared to have more beneficial effects than did people who at the onset had a perception of high degree of control over their illness and ability to cope with the symptoms. One way of addressing this would have been to ensure that at baseline all clients’ scores were within the dysfunctional range. This would, however, have the disadvantage of excluding clients for treatment who are dysfunctional in one of the other key areas of the disorder. A larger sample size may have accounted for this limitation.
Participants recruited to this study were interviewed about their understanding of psychosis, their expectations of treatment and their consequent experiences of the intervention pre and post intervention, but it has not been possible within the scope of this paper to report the interview findings fully. However, they will be written up in a separate paper and may be important, since awareness of factors that may influence hopelessness, perceived control and satisfaction is important if we are to be able to understand the subjective experiences of the participants and develop relevant future interventions.
Within current NHS services it would be of value if the relapse prevention intervention were to be implemented by the clients’ care co-ordinator. It is therefore recommended that additional research is undertaken examining the effectiveness of both delivery of the intervention by care coordinators and the use of additional booster sessions. Within these sessions the handbook should be updated as new information regarding symptoms and coping strategies emerge and as the client potentially gains more insight into their illness.
 This is an open access article distributed under the terms of the Creative Commons
Attribution License (